Enter the Chart Title, X-Axis Title and Primary Y-Axis Title in their respective boxes.
Enter the Secondary Y-Axis Title if you are designing a Dual Y-Axis chart.
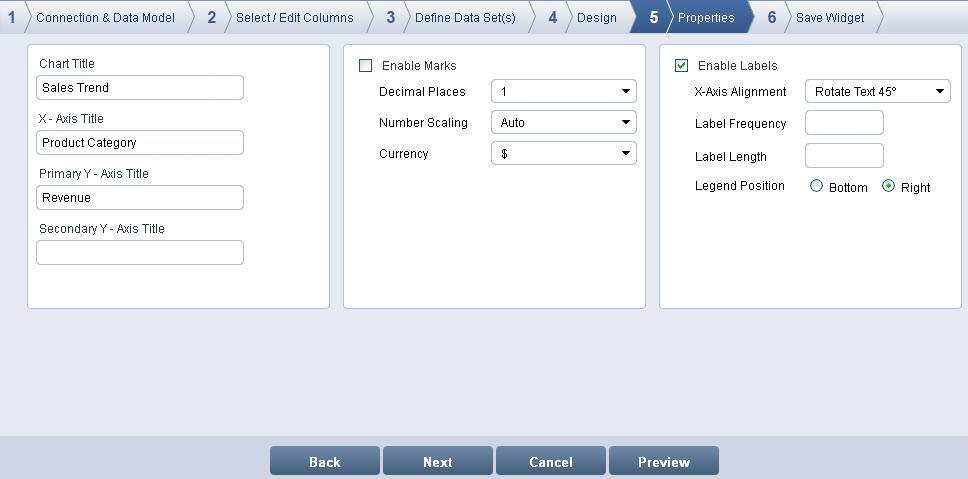
Properties screen
Select Enable Marks to enable marks in the chart.
Decimal Places - This allows you to set the precision of numbers after the decimal point. Select the precision number from the drop down list.
Number Scaling - This allows you to apply predefined scales to the marks on the chart. The available options are: Auto, K, M.
Select Auto to display chart marks without scaling
Select K to define marks in terms of Thousands.
Select M to define marks in terms of Millions.
Currency - This allows you to apply currency symbols to the marks on the chart.
Select None to display the marks without applying currency symbols.
Select  to prefix the US Dollar
marks on the chart.
to prefix the US Dollar
marks on the chart.
Select  to prefix the Chinese
Yuan marks on the chart.
to prefix the Chinese
Yuan marks on the chart.
Select  to prefix the Pound marks
on the chart.
to prefix the Pound marks
on the chart.
Select  to prefix the Euro marks
on the chart.
to prefix the Euro marks
on the chart.
Select Rs. to prefix the Rupee marks on the chart.
Select Enable Labels option to display X-Axis data labels for the chart.
X-Axis Alignment: This allows you to set the alignment for the X-Axis data labels.
Horizontal - displays the X-Axis labels horizontally.
Rotate Text 45°- rotates the X-Axis labels to 45 degree.
Rotate Text 90°- rotates the X-Axis labels to 90 degree.
Enter the label frequency that allows you to set the frequency of labels to appear in Label Frequency.
Enter the label length that allows you to define the length of the characters in X-Axis labels in Label Length.
Legend indicates the colors used to represent each of the series elements in a chart. Legends make the chart self-explanatory. The Legends tab is visible only for the series chart. Select Bottom or Right from the Legend Position to define the position of the legend.
Following are the labels enabled only for Multi Series chart.
Prefix Series name - displays chart values with prefix series name
Include Column name - displays chart values with column name
Include aggregation function name - displays the data set name along with the aggregate function name.
Click Preview to preview the chart.
Click Next to display Save Widget screen. To exit the screen, click Cancel.