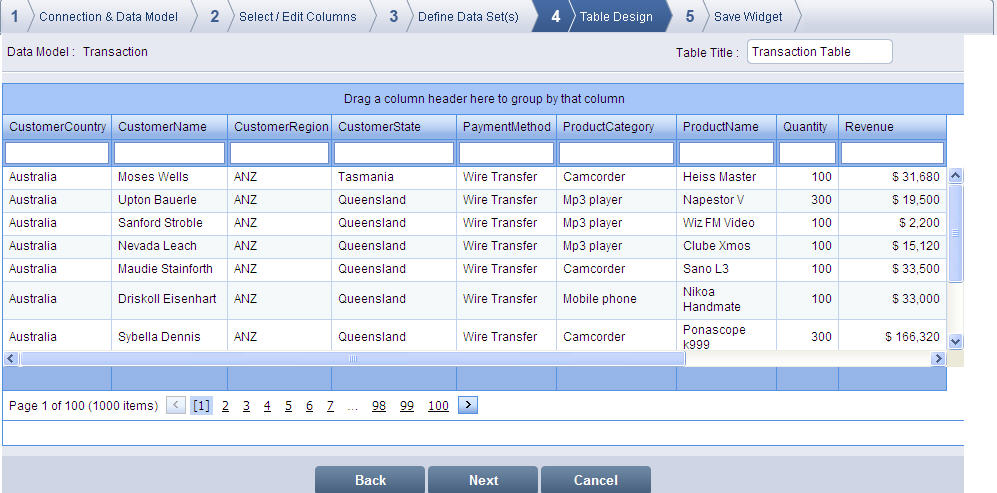
The Table Design screen displays the table for the table data set that you have defined.
Table Design screen
Enter a title for the table in Table Title.
To navigate through the records, click a specific
page number link or the  previous/next
  page
arrows. You can view the total number of records is displayed next to
the current page and total number of navigation pages.
page
arrows. You can view the total number of records is displayed next to
the current page and total number of navigation pages.
To group the table by a specific column, drag and drop the column in grouping band. For Example:
The screen shows the table grouped by Customer Country.
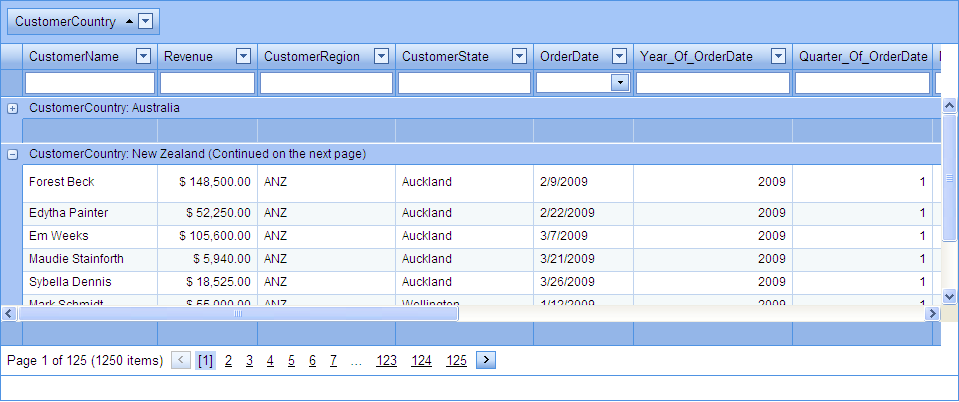
Grouping by Column
To display the right-click options for the table, right-click a column header in the table.
Expand All - Expands the data of the grouped column.
Collapse All - Collapses the data of the grouped column.
Sum - displays sum of the column values in group footer. For Example:
The initial screen shows the pop-up menu by right-clicking the column header Revenue.
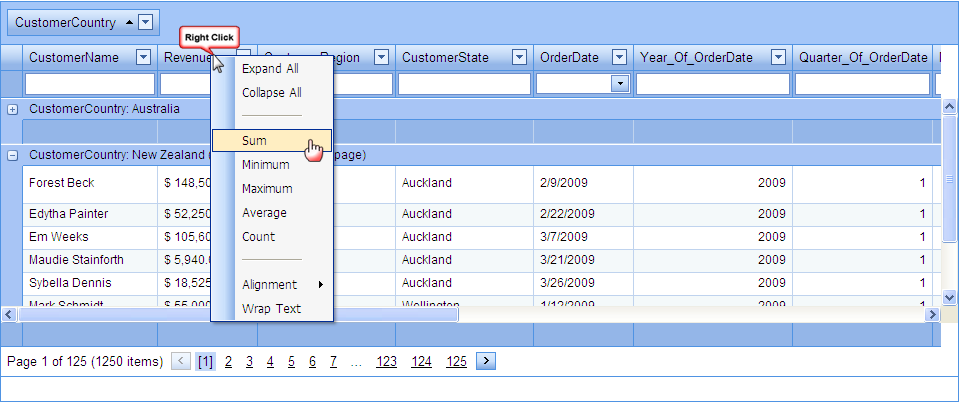
Right-click options for table
The following screen shows the sum of Revenue displayed at the group footer for the selection of the aggregate function "sum" in the above screen.
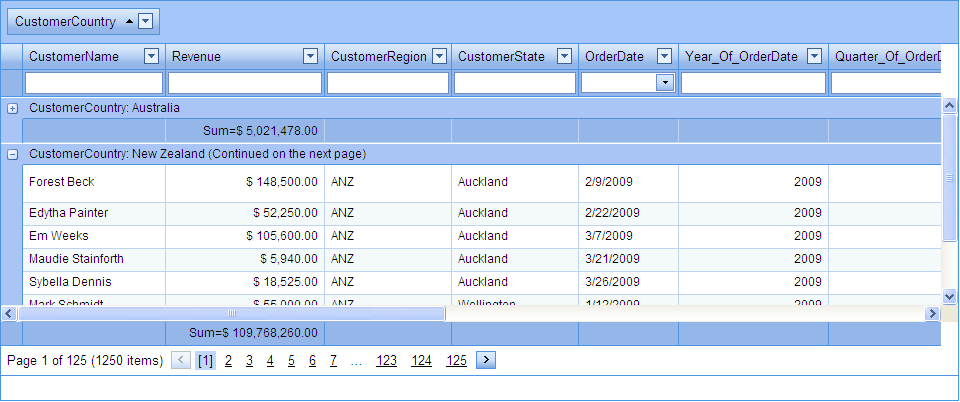
Aggregate function for Revenue
Minimum - displays the highest column value in group footer.
Maximum - displays the lowest column value in group footer.
Average - displays the average of the column values in group footer.
Count - displays the count of column values.
Alignment - aligns the column values to the Left, Right or Center of each cell.
Wrap Text - wrap the column values to the width of each cell.
Note: You can use the aggregate functions (Sum, Minimum, Maximum, Average, count) to calculate and summarize the data.
Click Next to display the Save Widget screen.
To return to the previous screen, click Back. To exit the screen, click Cancel.