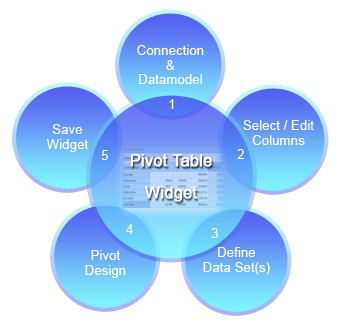
In the Pivot Table Widget, each column, row or data field in your source data becomes a Pivot Table field that summarizes multiple rows of information. You can configure the pivot table chart in the following ways: For example, You must initially connect to a database and a data model; select columns; define data set; drag and drop columns in row, column and data fields and save.
You can manipulate the data by sorting, filtering and grouping certain data to enable you to focus on the information that you want.
* Click on any widget process to view its detailed description