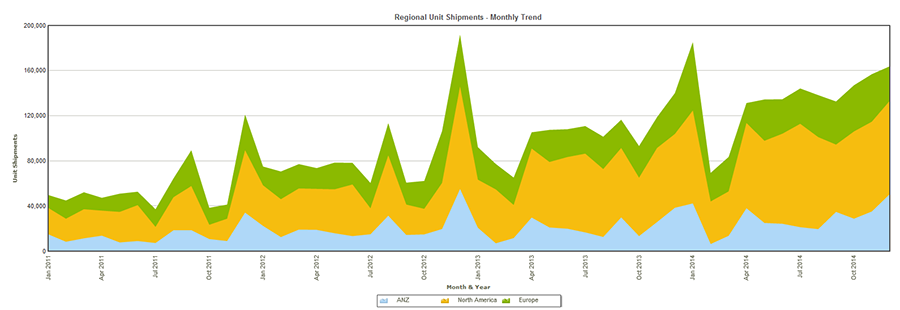
A stacked area chart shows the contribution of different categories to the whole. In a stacked are chart more than one data series is plotted. Image below shows a stacked area chart that shows the comparative quantity of products shipped to each geographical area over time.
![]()
<<Area Charts | Spline Area Charts>>