To set exceptions:
Use the Set Exceptions step in the widget design to achieve one of the following:
![]() Note:
Note:
Click Back to go to the Design page. Click Cancel to exit creation of widget. To preview the widget, click Preview
(a) Choose to have the chart displayed in system-determined colors or in grey scale by selecting the Set Chart Color option and one of the displayed options detailed below:
Default – select this option for an automatic selection of colors for the various charts, based on system-determined parameters
Gray Scale – select this option if want the chart to use different gray scale shades instead of colors, for enabling users to print it using a black and white printer

Set Exceptions screen
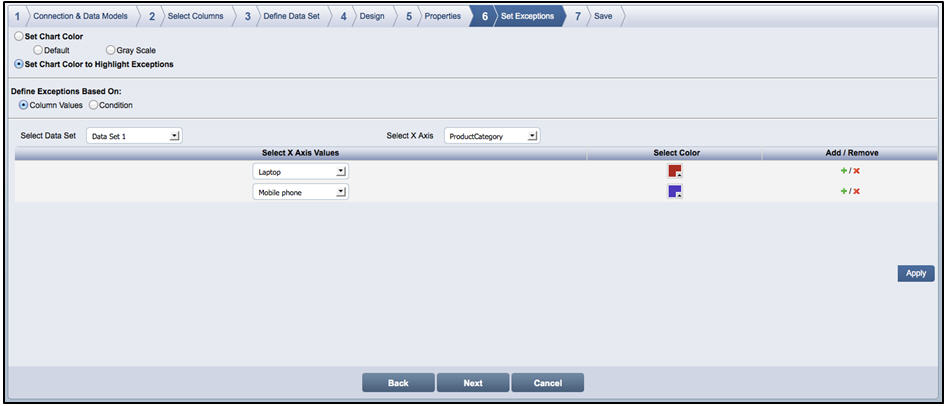
(b) Manually set the chart color to specific unique X Axis column values or have the chart color reflect certain business exception conditions by using the Set Chart Color to Highlight Exceptions option and one of the displayed options detailed below:
Column Values - Use this option to predetermine the color to be used by specific values of the X-Axis column. For the Product Category column used as the X Axis Column, if you want the chart color for Laptop to be red and the chart color for mobile phones to be purple, you can use the Column Values option. This allows you to easily identify the product category values in the chart without reading the X-Axis label. You can define the chart color associated with the selected column values by adding details as required and clicking Apply to save the changes. For field description, refer Field Description – Column Values
Field Description - Column Values:
|
Field |
Description |
|
Select Data Set |
Select the appropriate data set from the Select Data Set drop-down list. |
|
Select X Axis |
Select the required x-axis column from the Select X Axis drop-down list. You need to choose the X-axis column for which you want to assign a unique color based on its unique values. If you have more than one column in the X-axis drill-down path, you can assign unique colors to the values of only one of the X-axis columns. |
|
Select X Axis Values |
Select the required x-axis column value from the Select X Axis Values drop-down list. You need to choose the specific X-axis column value for which you want to assign a unique color. |
|
Select Color |
Click |
|
Add/Remove |
If you want to assign a color to more than one unique value of the selected X-axis column, click To remove the row, click |
![]() Note:
Note:
In the Set Chart Color section, select Default to disable or turn off any defined exceptions based on column values
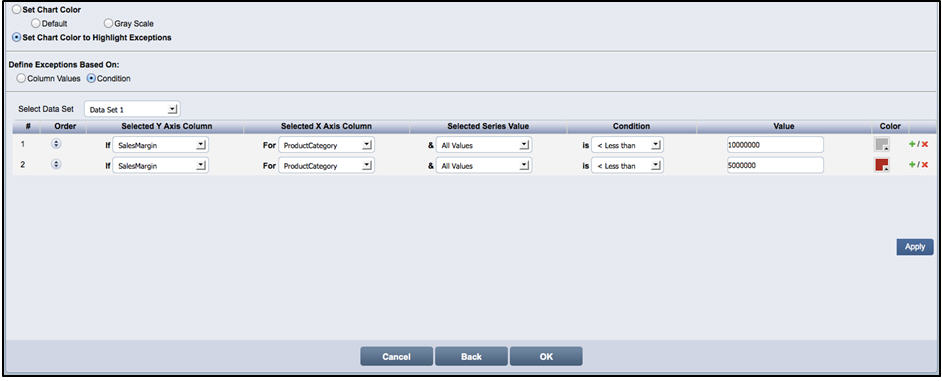
Conditions - Use this option to define conditions based on a Y Axis Column and X Axis Column combination. If the defined exception condition is triggered while viewing the report, the respective display area in the chart is highlighted using the color selected for that condition
For example, if you used Sales Margin Amount as the Y-Axis column and Product Category as the X-Axis column, and want to trigger an exception if the sales margin amount for any product category falls below a threshold value, then you can select Sales Margin in the Y-Axis column. You can select Product Category in the X-Axis column and define one or more threshold conditions (Gray - if the sales margin amount is < $10,000,000 and Red - if it is < $5,000,000). Whenever you view the report, each of the exception conditions that have been defined is validated and if the condition is triggered, the respective display area in the chart is highlighted in Red or Gray. For field description, refer Field Description-Condition
![]() Note:
Note:
The exceptions are processed in a top to bottom sequence. If there is an overlap in conditions, the last condition in the list overrides the first condition in the list. In this example, if a product category’s sales margin amount is $1,000,000, it will meet the first condition and the second condition but the second condition will prevail as it comes later in the list and the display area will be highlighted in Red.
In the Set Chart Color section, select Default to disable or turn off any defined exceptions based on conditions.
The exception conditions defined in the Set Exceptions page can be used to setup Alert Monitoring under the Scheduler/Alerts menu. For more information, refer Add Schedule for Alert Monitoring
Field Description - Condition
|
Field |
Description |
|
Select Data Set |
Select the appropriate data set from the Select Data Set drop-down list. |
|
# |
Displays the order of the conditions that are defined. |
|
Order |
Right-click on the Order icon |
|
Selected Y-Axis Column |
From the drop-down list, select the Y-axis column for which you want to define a condition |
|
Selected X-Axis Column |
Select the corresponding x-axis column from the drop-down list. |
|
Selected Series Value |
This selection is required only if there is a column in the Series area of the chart design. If you used a series column, this drop-down lists the unique values of the series column. This allows you to define a unique condition for each unique value of the series column, if required. |
|
Condition |
Select the condition from the drop-down list. The options are <Less than, >Greater than, = Equal to, and <> Between. |
|
Value |
Enter the value in the Value text box. If you selected <>Between in the Condition drop-down list, two text boxes are displayed where you can enter the From and To values |
|
Color |
Click |
|
Add/Remove |
Click |
Click Next. The Save page is displayed.
![]() Note:
Note:
Click Back to go to the Properties page. Click Cancel to exit creation of widget
![]()
<<Properties | Save>>