To define properties:
On the Properties page, add details as needed and click Apply. For chart types with single data set, refer Field Description – Properties (Chart Type with Single Data Set). For chart types with one/multiple data sets, refer Field Description – Properties (Chart Type with One/Multiple Data Sets).
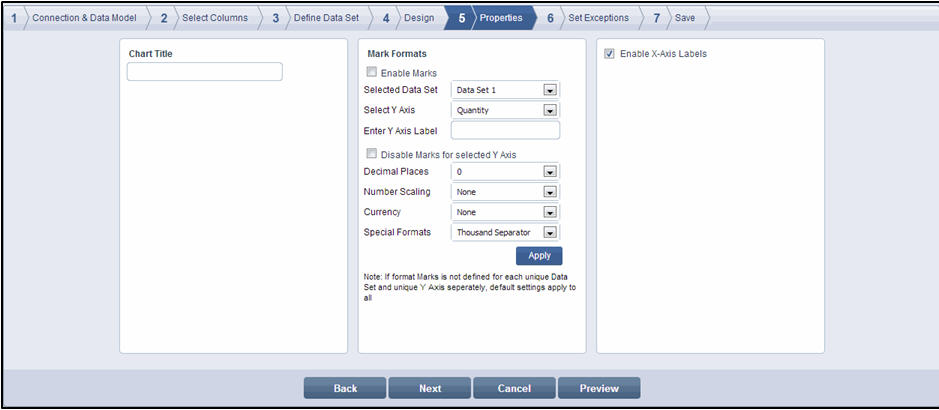
Properties screen
![]() Note:
Note:
If mark formats are not defined for the data set and the Y-axis, default settings apply
Field Description - Properties (Chart Type with Single Data Set)
|
Field |
Description |
|
Chart Title |
Enter a title for the chart |
|
Enable Marks for Y Axis Column |
|
|
Enable Marks |
Select this check box to enable marks display on the chart |
|
Marks Alignment |
Select the alignment for the marks. Options available are Horizontal and Vertical. If there are too many unique Y-axis values to display as marks, you can use the Marks Alignment option that best displays the marks and minimizes overlapping marks. The Marks Alignment option is not available for Pie, Doughnut, Funnel, and Gauge chart types |
|
Selected Data Set |
Chart types with single data set have only 1 data set listed as they can only support 1 data set. |
|
Select Y Axis |
Chart types with a single data set have only1 Y-axis listed. |
|
Enter Y Axis Label |
The default value for the Y Axis Label is the name of the Y-axis column. If you have performed computations on the Y-axis column or if you are using the Y-axis column to represent a metric that is not evident from the name of the Y-axis column, you can enter a label for the Y-axis and have it replace the Y-axis column name. |
|
Disable Marks for selected Y Axis |
You can use this check box if you want to disable marks for the selected Y-axis column. When the Disable Marks for selected Y Axis check box is selected, the Decimal Places, Number Scaling, Currency, and Special Formats fields become non-editable. |
|
Decimal Places |
Select the number of decimal places from the drop-down list. |
|
Number Scaling |
Select the value for number scaling. The options are:
|
|
Currency |
Select the currency from the drop-down list. The options are $, ¥, £, €, and |
|
Special Formats |
If needed, select the special format from the drop-down list. The options are:
|
|
Define X Axis Label Properties |
|
|
Enable X Axis Labels |
Select the check box to enable labels for the X Axis. The X-axis labels are enabled by default and the unique X-axis values are displayed as the X Axis labels. |
|
X-Axis Alignment |
Select the alignment for the X-axis from the drop-down list. The options are Horizontal, Rotate Text 45 degrees, and Rotate Text 90 degrees. If there are too many unique X Axis values, you can use the alignment option that best displays the labels and minimizes overlapping labels. X Axis alignment is only applicable to the waterfall chart type with single data set. It is not applicable for any other chart types with a single data set |
|
Label Frequency |
Enter the label frequency in the text box. If there are too many unique X Axis values, use this option to display every 5th or 10th value as the label. This reduces the clutter on the X Axis and makes the labels more readable. X Axis alignment is only applicable to the waterfall chart type with single data set. It is not applicable for any other chart types with a single data set. |
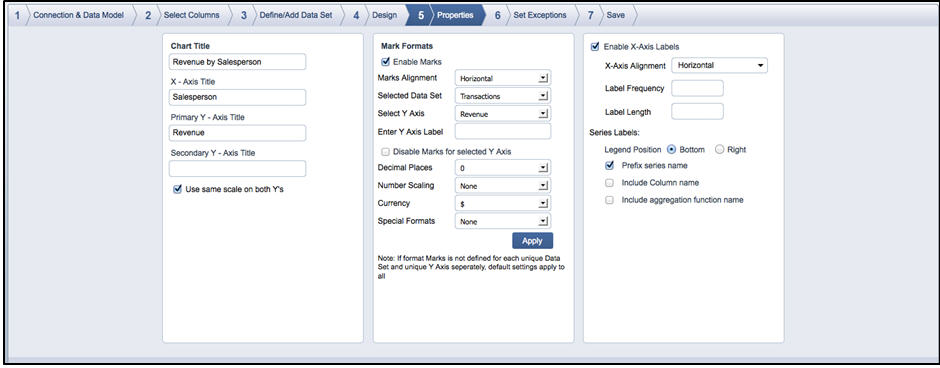
Field Description - Properties (Chart Type with One/Multiple Data Set)
|
Field |
Description |
|
Chart Title |
Enter a title for the chart |
|
X-Axis Title |
Enter a title for the X-axis |
|
Y-Axis Title |
Enter a title for the Y-axis |
|
Primary Y-Axis Title |
Enter a title for the primary Y-axis. If there is more than one Y Axis column in the Y Axis section, this text box is used for the Primary Y Axis Title |
|
Secondary Y-Axis Title |
Enter a title for the secondary Y-axis. If there is more than one Y Axis column in the Y Axis section, this text box is used for the Secondary Y Axis Title |
|
Use same scale on both Y’s |
Select this check box if you want to use the same scale for the both the primary and secondary Y-axes |
|
Enable Marks for Y Axis Column |
|
|
Enable Marks |
Select this check box to enable marks display for the Y Axis values in the chart |
|
Marks Alignment |
Select the alignment for the marks. Options available are Horizontal and Vertical. If there are too many unique Y-axis values to display as marks, you can use the Marks Alignment option that best displays the marks and minimizes overlapping marks. The Marks Alignment option is not available for Pie, Doughnut, Funnel, and Gauge chart types |
|
Selected Data Set |
Chart types with single data set have only 1 data set listed as they can only support 1 data set. For Chart types with one/multiple data sets, where you have defined more than 1 data set, you can use this drop-down list to select a data set. Selecting the data set from the drop-down list alters the Select Y Axis drop-down list and displays the Y-axis associated with the selected data set. |
|
Select Y Axis |
Chart types with a single data set have only1 Y-axis listed. For chart types with one/multiple data sets, where you have used more than 1 Y-axis column in the chart design, you can use this option to select the different Y-axis columns and format the marks associated with each Y-axis column differently |
|
Enter Y Axis Label |
The default value for the Y Axis Label is the name of the Y-axis column. If you have performed computations on the Y-axis column or if you are using the Y-axis column to represent a metric that is not evident from the name of the Y-axis column, you can enter a label for the Y-axis and have it replace the Y-axis column name |
|
Disable Marks for selected Y Axis |
If you are using multiple Y-axis columns in the chart design or have more than 1 Y-axis because you have defined more than 1 data set, you may want to enable or disable marks for each of the Y-axis columns instead of using the global setting for all the Y-axis columns you have used. You can use this check box if you want to disable marks for the selected Y-axis column while the Enable Marks check box as a global setting is still selected. When the Disable Marks for selected Y Axis check box is selected, the Decimal Places, Number Scaling, Currency, and Special Formats fields become non-editable. |
|
Decimal Places |
Select the number of decimal places from the drop-down list. |
|
Number Scaling |
Select the value for number scaling. The options are:
|
|
Currency |
Select the currency from the drop-down list. The options are $, ¥, £, €, and |
|
Special Formats |
If needed, select the special format from the drop-down list. The options are:
|
|
Define X Axis Label Properties |
|
|
Enable X Axis Labels |
Select the check box to enable labels for the X Axis. The X-axis labels are enabled by default and the unique X-axis values are displayed as the X Axis labels |
|
X-Axis Alignment |
Select the alignment for the X-axis from the drop-down list. The options are Horizontal, Rotate Text 45 degrees, and Rotate Text 90 degrees. If there are too many unique X Axis values, you can use the alignment option that best displays the labels and minimizes overlapping labels. |
|
Label Frequency |
Enter the label frequency in the text box. If there are too many unique X Axis values, use this option to display every 5th or 10th value as the label. This reduces the clutter on the X Axis and makes the labels more readable |
|
Label Length |
Enter the length for the label in the text box. If one of more of the X Axis labels have too many characters, you can limit the length of the displayed label and minimize label overlap (for horizontal labels) and increase the size of the chart display (for labels that are aligned at 45 or 90 degrees). |
|
Define Series Properties (only applicable if there is a column in the Series section of Chart Design) |
|
|
Legend Position |
Specify the legend position. You can choose either Bottom or Right. |
|
Prefix series name |
By default, this check box is selected |
|
Include Column name |
Select this check box if you want to display the column name in the chart. |
|
Include aggregation function name |
Select this check box if you want to display the aggregation function name in the chart. |
Click Next. The Set Exceptions page is displayed
![]() Note:
Note:
Click Back to go to the Design page. Click Cancel to exit creation of widget. To preview the widget, click Preview
![]()
<<Design | Properties>>