A line chart or line graph is a type of chart which displays information as a series of data points connected by straight line segments. Line charts are typically used to track changes in data over periods of time. Multi-series Line charts show changes in more than one group of data over the same period of time.
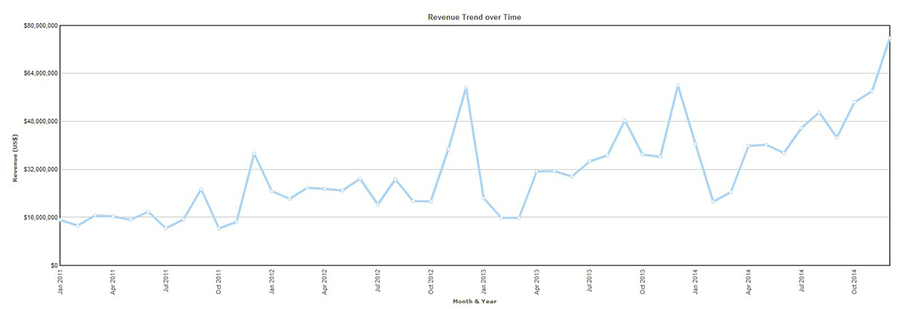
In the example below, the line chart illustrates the organizational ‘Revenue Trend’ over time. As can be seen in example, revenue trends over several years showing seasonal peaks and dips can be illustrated effectively using line charts.
Fig. Line charts
![]()
<<3-D Bar Charts | Spline Charts>>