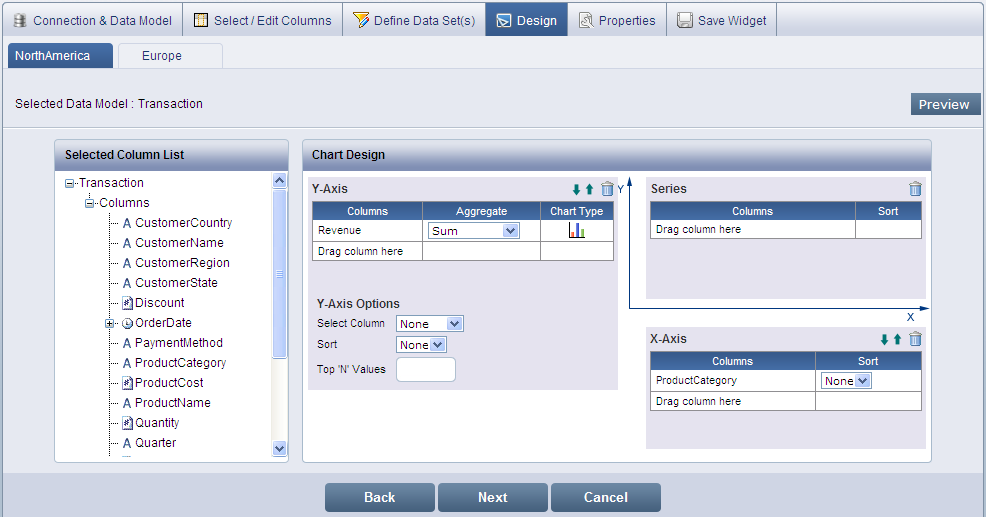
You can display a column series and a line series on the same chart using two different data sets, for example, North America and Europe. You can compare the two series that share a common X axis (Product Category) and Y axis (Revenue).
Column Series
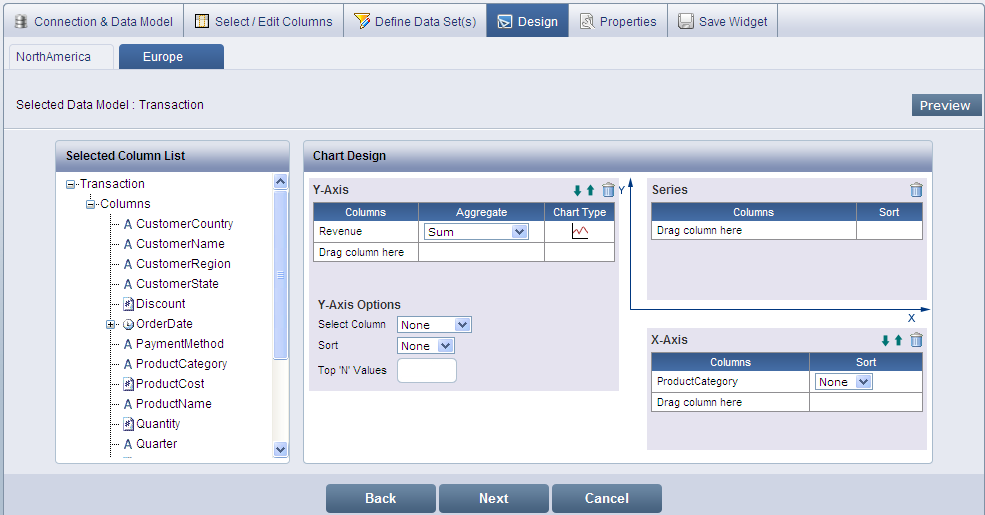
Line Series
The advantage of using multiple series is to display two or more charts bound to different data series on the same chart area. Usually these data series are semantically related and putting them together allows the user to compare the values easily.
The following screen shows the two series comparison for the two different data sets on the same chart.
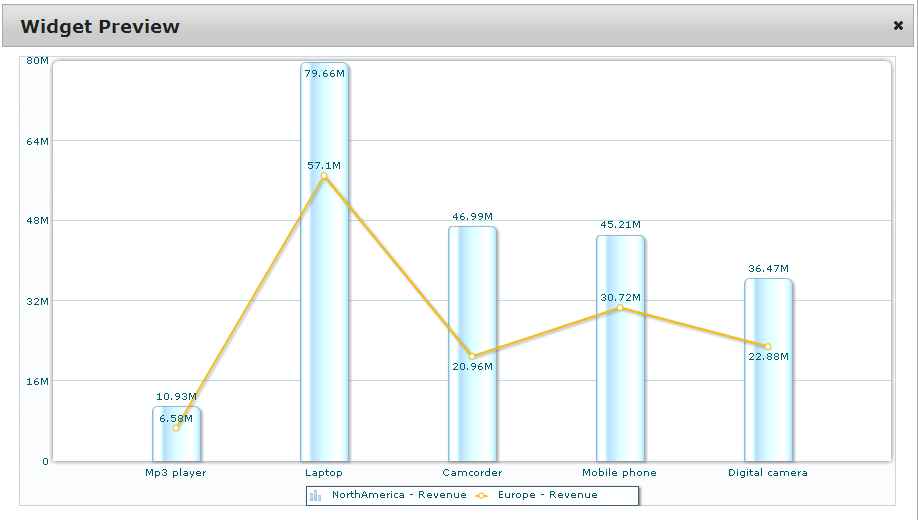
Multi Series chart