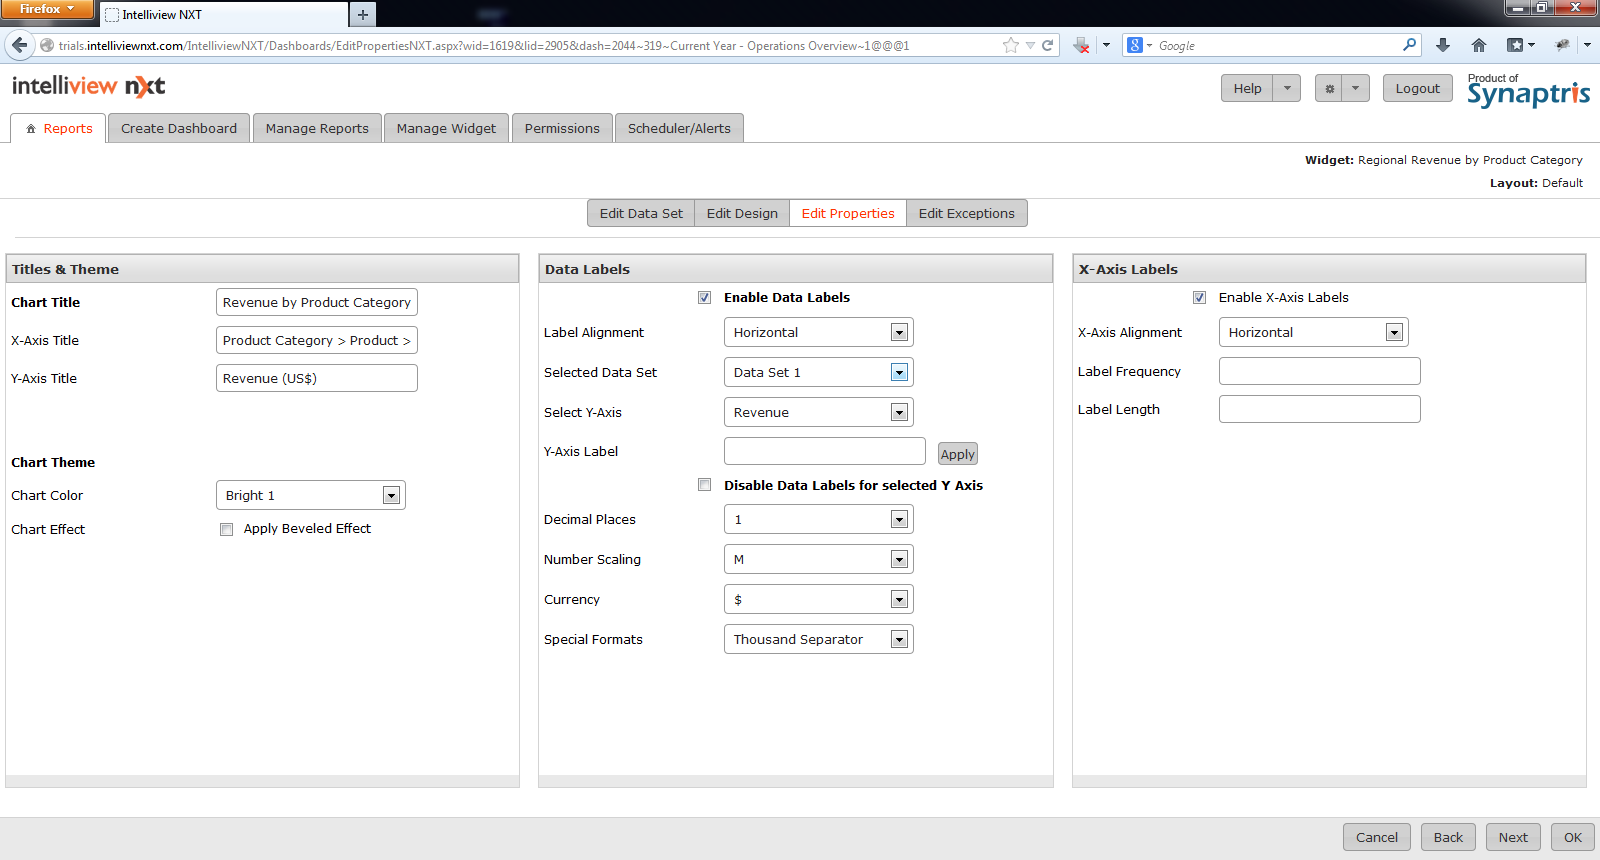
You can edit properties of the widgets such as title, marks and labels, in the properties page. The fields on the ‘edit properties’ page are illustrated and explained below.
| Field | Description |
| Chart Title | Enter a title for the chart/widget. |
| Chart Color | Choose a color theme (bright, pastel, blue, green etc) for your chart from dropdown list. |
| Chart Effect | Check this box if you wish your graphs to be bevelled in appearance. |
| Enable Data Labels for Y Axis Column | |
| Enable Data Labels | Select this check box to display data labels on the chart. |
| Label Alignment | You can choose to display data labels either horizontally or vertically |
| Selected Data Set | Chart types with a single data set have only1 dataset listed. |
| Select Y Axis | Chart types with a single data set have only1 Y-axis listed. |
| Y Axis Label | The default value for the Y Axis Label is the name of the Y-axis column. If you have performed computations on the Y-axis column or if you are using the Y-axis column to represent a metric that is not evident from the name of the Y-axis column, you can enter a label for the Y-axis and have it replace the Y-axis column name. |
| Disable data labels for selected Y Axis | You can use this check box if you want to disable marks for the selected Y-axis column. When the Disable data labels for selected Y Axis check box is selected, the Decimal Places, Number Scaling, Currency, and Special Formats fields become non-editable. |
| Decimal Places | Select the number of decimal places from the drop-down list. |
| Number Scaling |
Select the value for number scaling. The options are:
|
| Currency |
Select the currency from the drop-down list. The options are $, ¥, £, €, and ₨. |
| Special Formats |
If needed, select the special format from the drop-down list. The options are:
|
| Define X Axis Label Properties | |
| Enable X Axis Labels | Select the check box to enable labels for the X Axis. The X-axis labels are enabled by default and each of the unique values of the column used in the X-axis are displayed as the X Axis labels. |
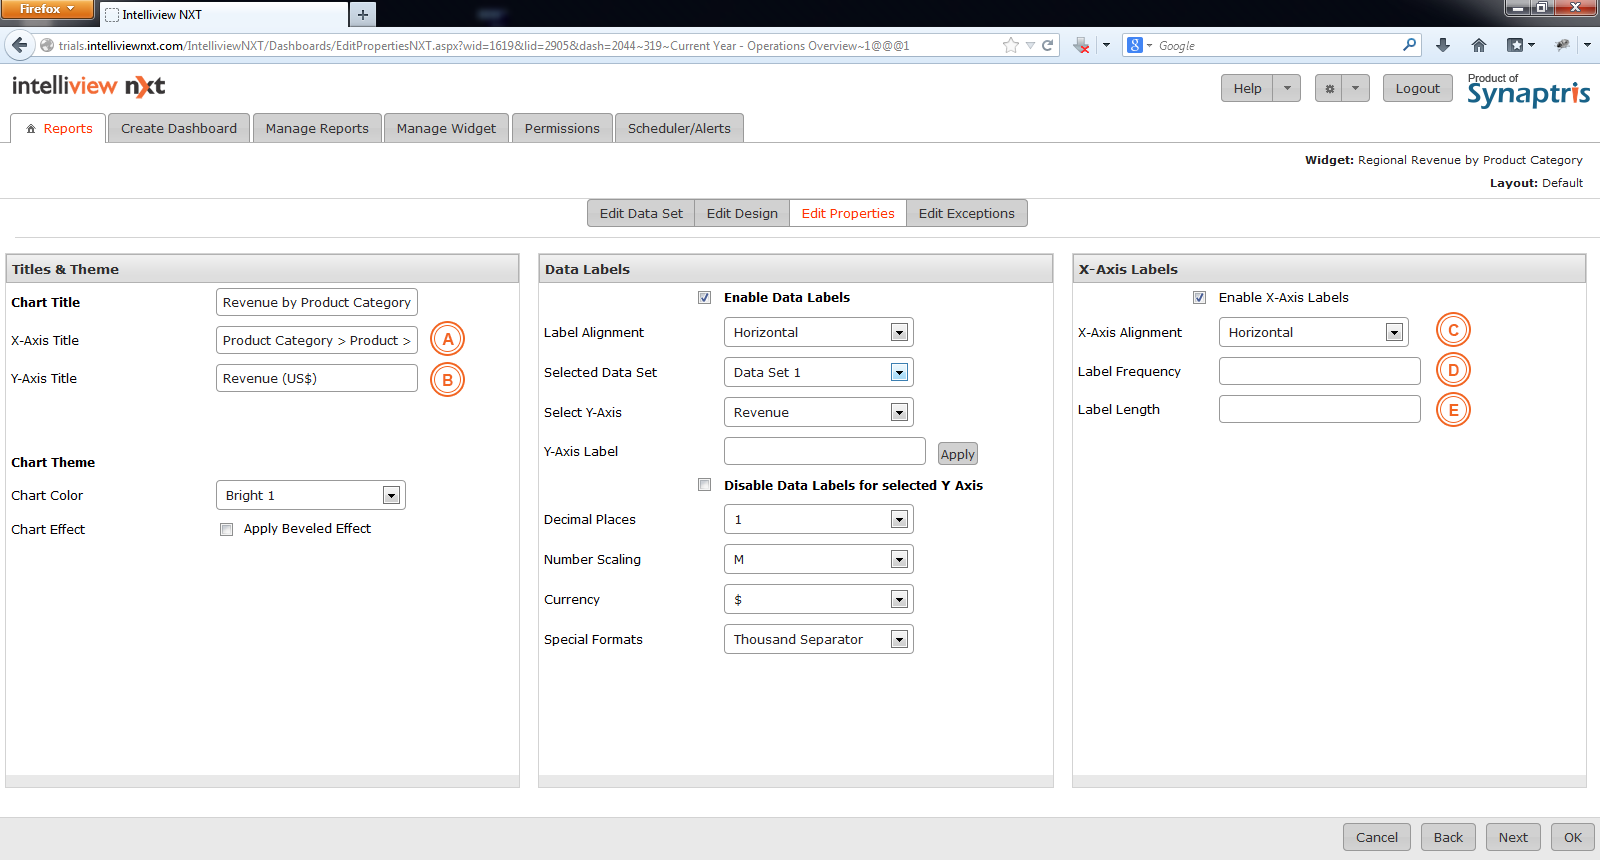
If you are editing/designing a Waterfall type chart, the Properties page is similar to the one presented for any of the multi series chart types and allows you some additional options as you can see below.
|
A |
On the Water fall chart you have option of giving the X-Axis a title. |
|
B |
Similarly, you can add a title to the Y-Axis too. |
|
C |
You can choose how the X-axis label is to be aligned across the image here. |
|
D |
If there are too many X Axis label values, you can specify the frequency to display the X Axis label. |
|
E |
If the X Axis label length is too long, you can restrict the length of the X-axis label here. |
For the Waterfall type chart, you can choose to align your X-axis label. The options are Horizontal, Rotate Text 45 degrees, and Rotate Text 90 degrees. If there are too many unique X Axis values, you can use the alignment option that best displays the labels and minimizes overlapping labels.
If there are too many unique X Axis values, use the label frequency option to display every 5th or 10th value as the label. This reduces the clutter on the X Axis and makes the labels more readable.
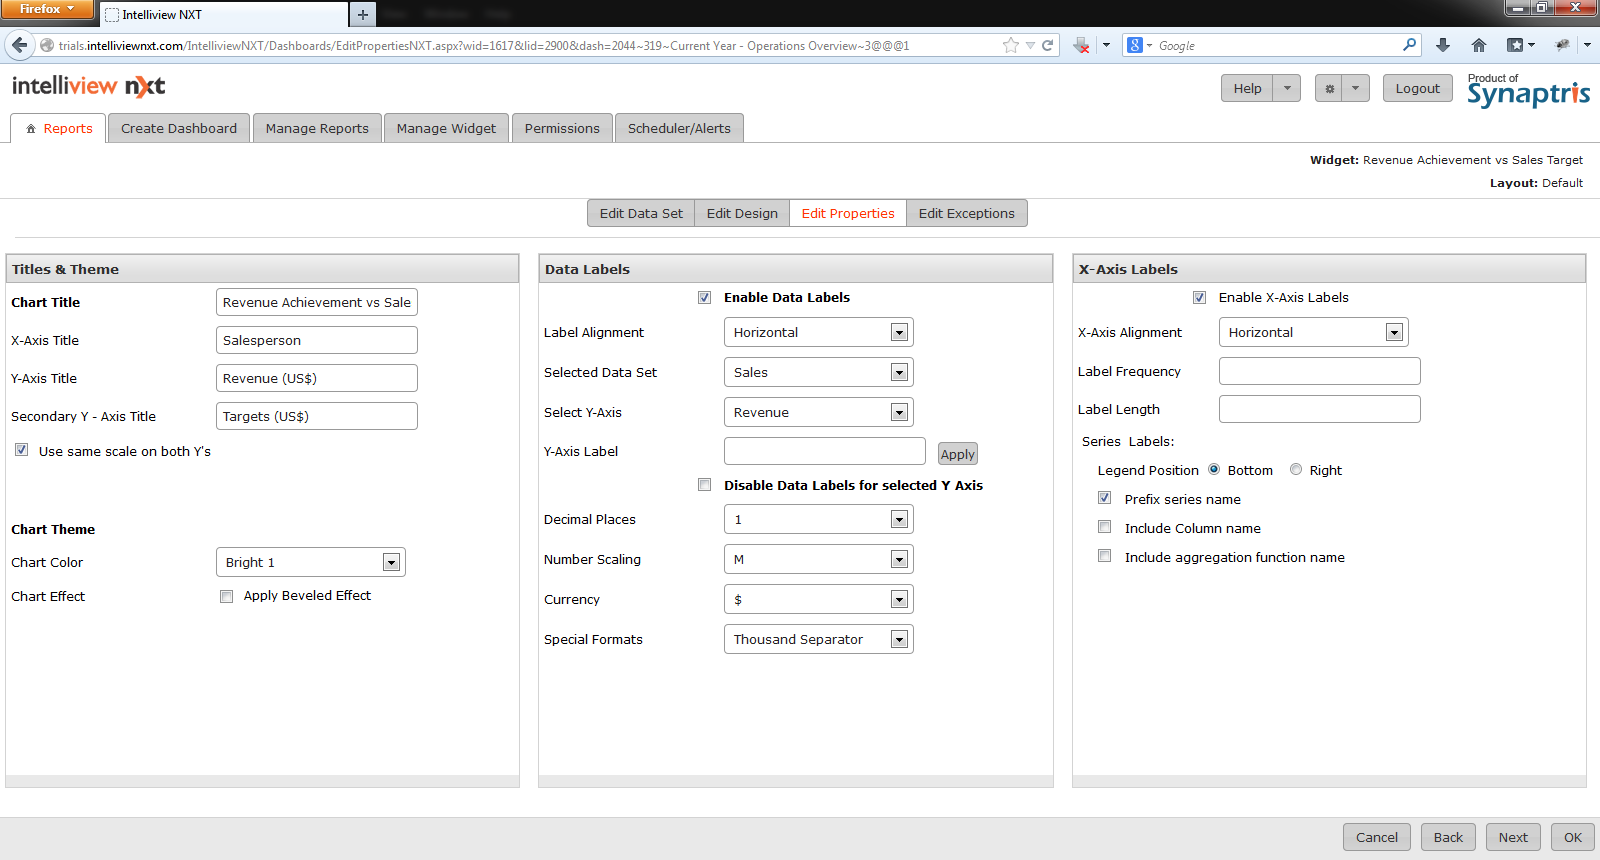
On this page you may edit titles, labels and other effects on your report. The table below the illustration explains the fields on this page in detail. All fields may be edited.
| Field | Description |
| Chart Title | Chart/widget Title |
| X-Axis Title | Label for X-Axis |
| Y-Axis Title | Label for Y-Axis |
| Chart Colour | Choose a color theme (bright, pastel, blue, green etc) for your chart from dropdown list. |
| Chart Effect | Check this box if you wish your graphs to be bevelled in appearance. |
| Enable Data Labels for Y Axis Column | |
| Enable Data Labels | Select this check box to display data labels on the chart. |
| Label Alignment | You can choose to display data labels either horizontally or vertically |
| Selected Data Set | Chart types with a single data set have only1 dataset listed. |
| Select Y Axis | If you are using more than 1 dataset or if you are using multiple Y axis in a dataset, pick the Y axis column for which you want to define labels. |
| Y Axis Label | The default value for the Y Axis Label is the name of the Y-axis column. If you have performed computations on the Y-axis column or if you are using the Y-axis column to represent a metric that is not evident from the name of the Y-axis column, you can enter a label for the Y-axis and have it replace the Y-axis column name. |
| Disable Data labels for selected Y Axis | You can use this check box if you want to disable marks for the selected Y-axis column. When the Disable Marks for selected Y Axis check box is selected, the Decimal Places, Number Scaling, Currency, and Special Formats fields become non-editable. |
| Decimal Places | Select the number of decimal places from the drop-down list. |
| Number Scaling |
Select the value for number scaling. The options are:
|
| Currency |
Select the currency from the drop-down list. The options are $, ¥, £, €, and ₨. |
| Special Formats |
If needed, select the special format from the drop-down list. The options are:
|
| Define X Axis Label Properties | |
| Enable X Axis Labels | Select the check box to enable labels for the X Axis. The X-axis labels are enabled by default and each of the unique values of the column used in the X-axis are displayed as the X Axis labels. |
| X-Axis Alignment | You can choose to have the X-Axis label aligned either vertically or horizontally. |
| Label Frequency | If there are too many X Axis label values, you can specify the frequency to display the X Axis label. |
| Label Length | If the X Axis label length is too long, you can restrict the length of the X-axis label. |
| Define Series Label Properties (The following fields will be available only when you use a column in the Series area of the Chart Design | |
| Legend Position | Displays each unique value of the Column used in Series as a unique color in the bottom or to the right of the chart. |
| Suffix series value | Displays the unique column value suffixed to the color block. |
| Include Column name | Displays the name of the Column used in the Y axis in addition to the color block and series value. |
| Include aggregation function name | Displays the aggregation function applied to the column used in the Y axis in addition to the color block and series value, |
![]()