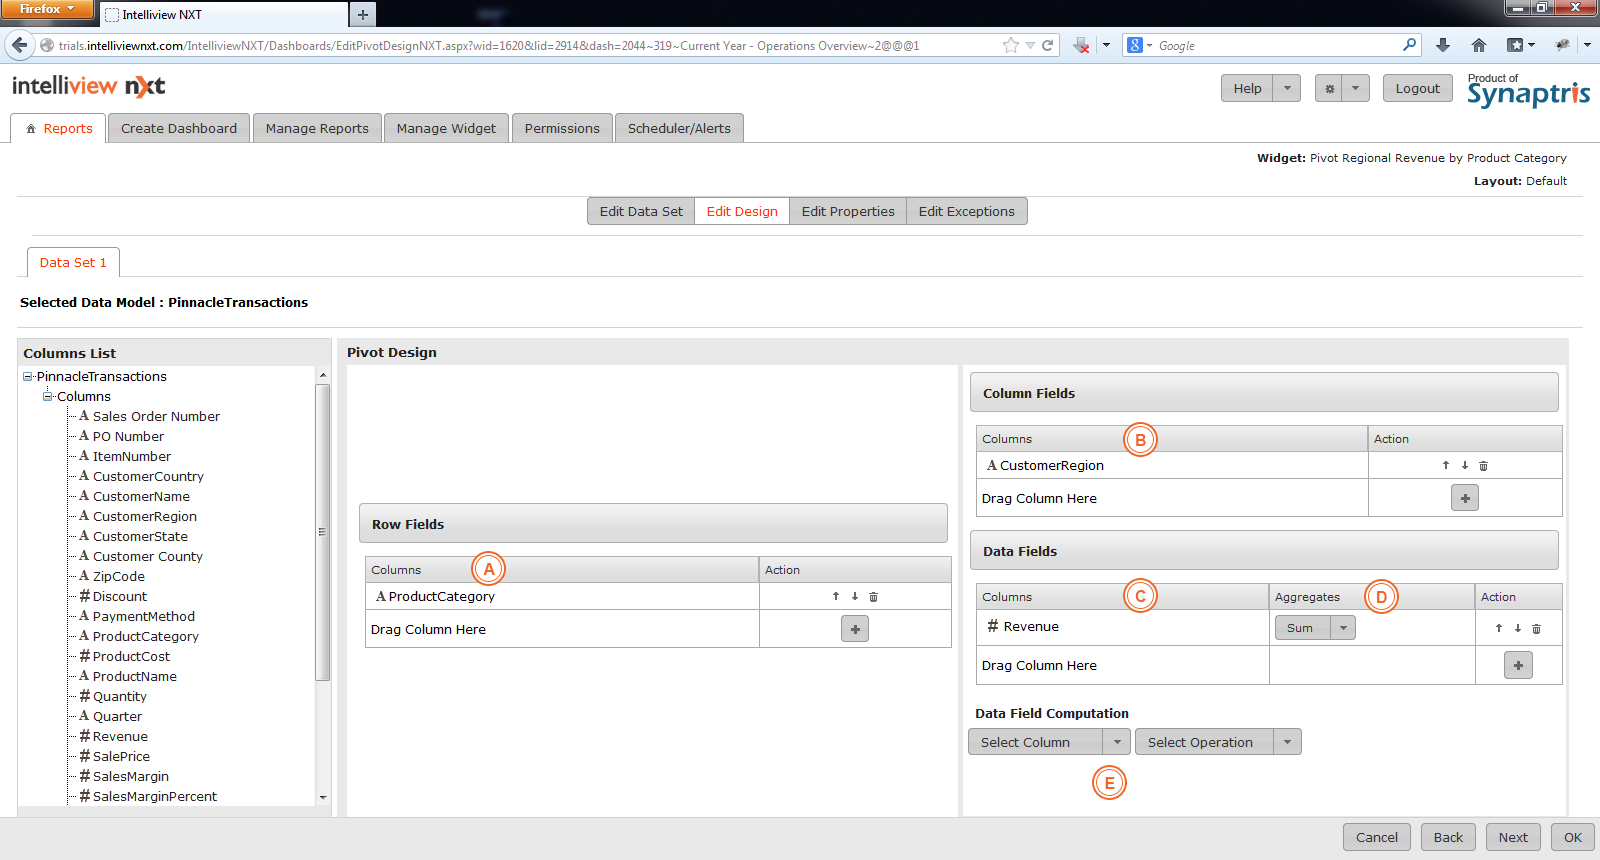
Below is a screen shot of the edit/design page for the Pivot widget.

|
A |
The column(s) that you choose to use here form the Row(s) of the pivot table. There will be a row displayed for every distinct value from the column used here. You may add more than 1 Column for sub-categorization (Drill down) of row data. |
|
B |
The column(s) that you choose to use here form the Column(s) of the pivot table. There will be a Column displayed for every distinct value from the column used here. You may add more than 1 Column for sub-categorization (Drill down) of Column data. |
|
C |
The column(s) you choose here will be summarized and presented for every unique Row & Column combination. You may add more than 1 column here to represent a summary for more than 1 column. |
|
D |
Choose from the summary function in the drop down list - the choices are Sum, Average, Max, Min, Count and Count Distinct. |
|
E |
If you wish to apply any computation to your data column, make the selection from this drop down list here. |
<< Edit Data Set of Pivot | Edit Properties of Pivot >>