Defining a dataset (a subset of data returned by the Data Model) is the process of filtering or removing certain values from the data columns that you have chosen to use in your report. Let us consider for example the column chart in the sample dashboard above. If you wished for instance to change the dataset that is used in the chart so that the column chart would only reflect revenue from payments made through wire transfer, you could easily achieve that by editing the underlying dataset. To do so, choose ‘Data Set’ under the edit option.
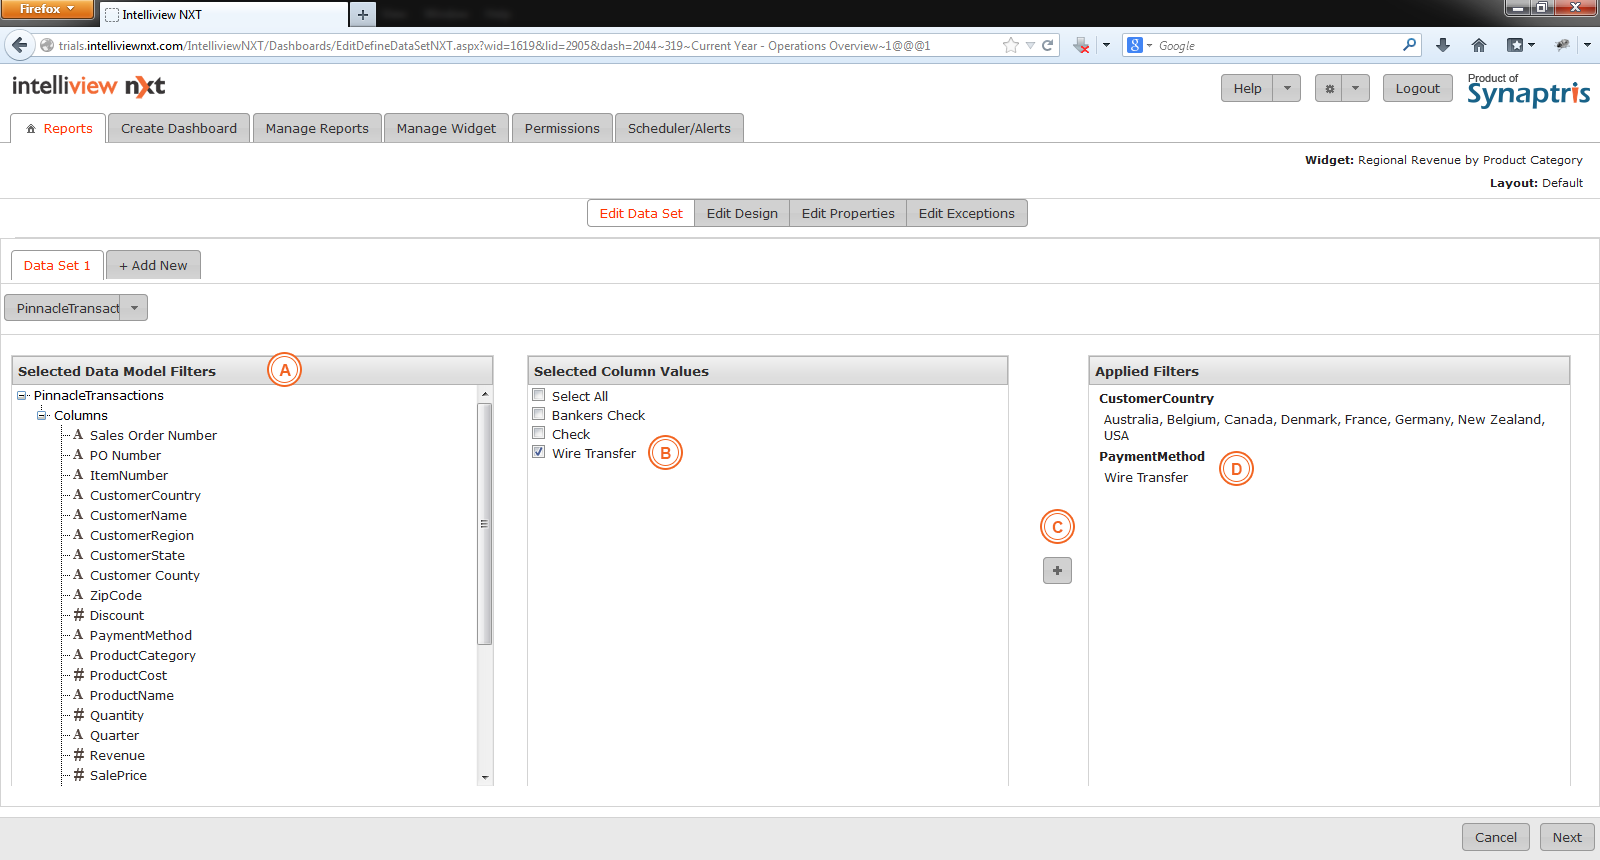
The image below illustrates how you select the desired column on the left (in this case, the ‘PaymentMethod’ column), uncheck all the column values you do not need and use the ‘+’ button to apply the value ‘Wire Transfer’ as the filter value for the PaymentMethod column.
|
A |
List of columns that can be filtered to obtain required data set. |
|
B |
Unique values under the “PaymentMethod” data column. Only ‘Wire Transfer’ is chosen. |
|
C |
Click this button to add the data filter. |
|
D |
The ‘Wire Transfer’ filter has been added to the other filters on this data set. |
In the above illustration we have added the “Wire Transfer’ filter to existing dataset. However if you wish, you may also create a new dataset by clicking on the “Add New” tab and adding your filters. You will only be able to add another dataset if the ‘one/multiple-dataset’ option had been chosen during the initial steps of widget design.
For more information on the multi dataset functionality of the Chart widget please refer to the “Add Widget – Creating Chart Widget with One/Multiple datasets” section.
It must be noted that even if you changed the chart type, from a single data series chart type to a type that supported multi-series data (like from pie type to column bar type) you will not be able to add an additional data set if the “single/multiple datasets” option had not been chosen in the initial steps for widget design
In subsequent steps you will be able to use the dataset that you just edited. When you have completed editing the data set, click on “Next” to go the next step.
Intelliview NXT offers you multiple options on how you use date column filters in your widget.
Amongst other things, this feature can help keep your widgets/dashboards current. For example, using this feature you may set a filter on the date column to have the widget only populate with data for periods such as ‘Last month’. With such a filter, as the database continues to evolve over time with new data, the report would also get updated every month for the previous month. This date column filter feature allows numerous convenient customisations and is explained in detailed below.
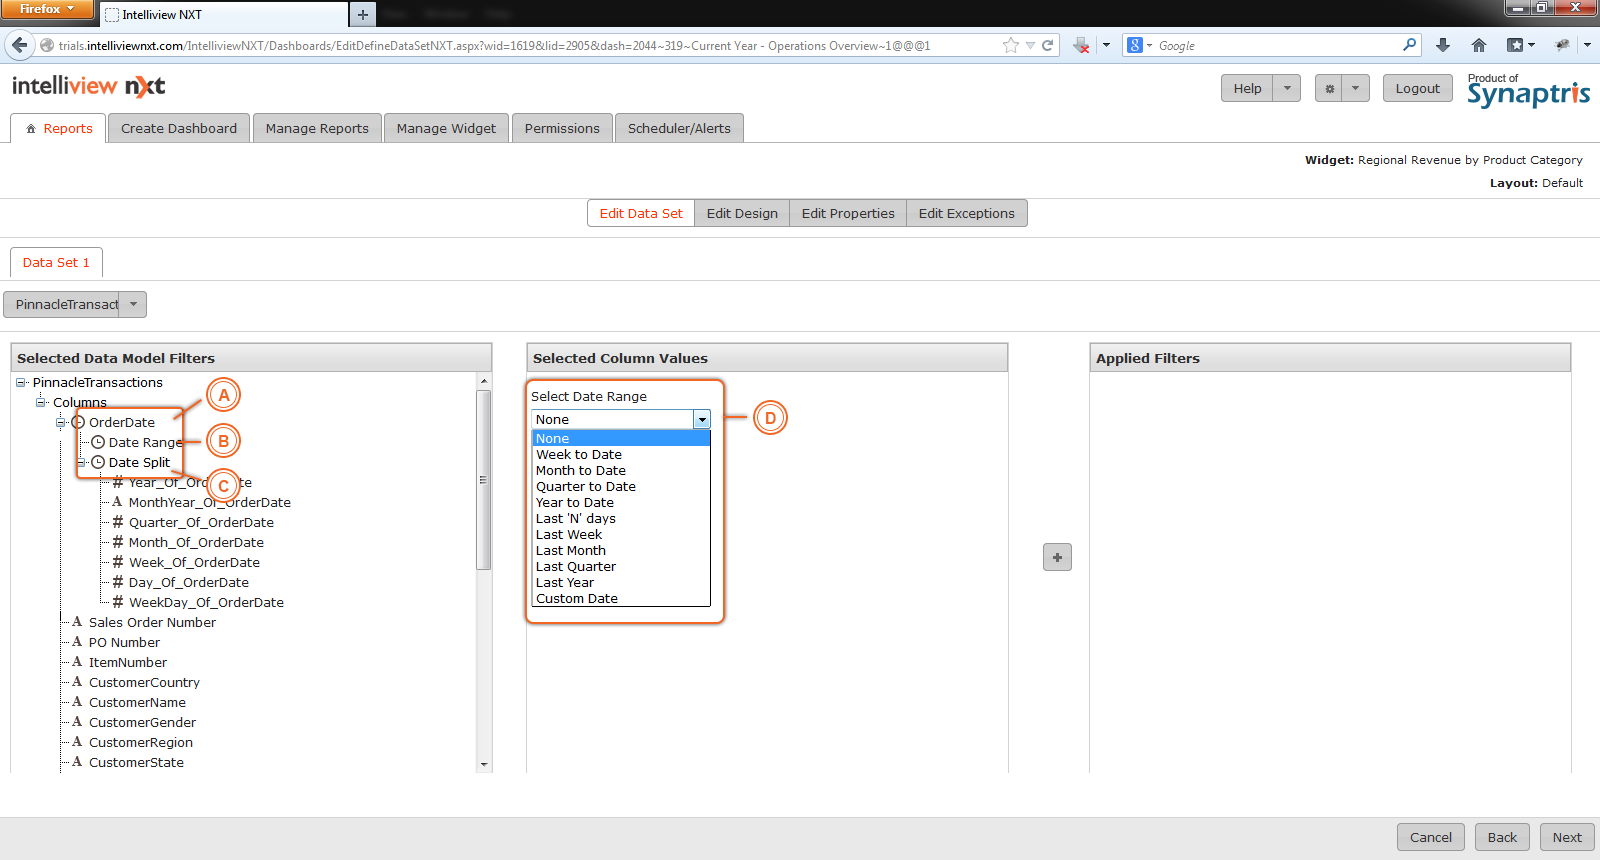
Two kinds of filters can be set up on date fields. One is the “Date Range” option while the other is the “Date Split”. If you use “Date Range” your reports will automatically be updated with additions to the database over time the illustration below shows expanded options available for date ranges.
|
A |
This data column ‘Orderdate’ in the database is a date field and filter options on this field are broadly divided into 2 categories, |
|
B |
One of the filter options is “Date Range”. The types of date range are shown in next panel, |
|
C |
The second filter option is “Date Split” – i.e the date field is split into various the components listed in next illustration. |
|
D |
Options available under “Date Range” are listed here. |
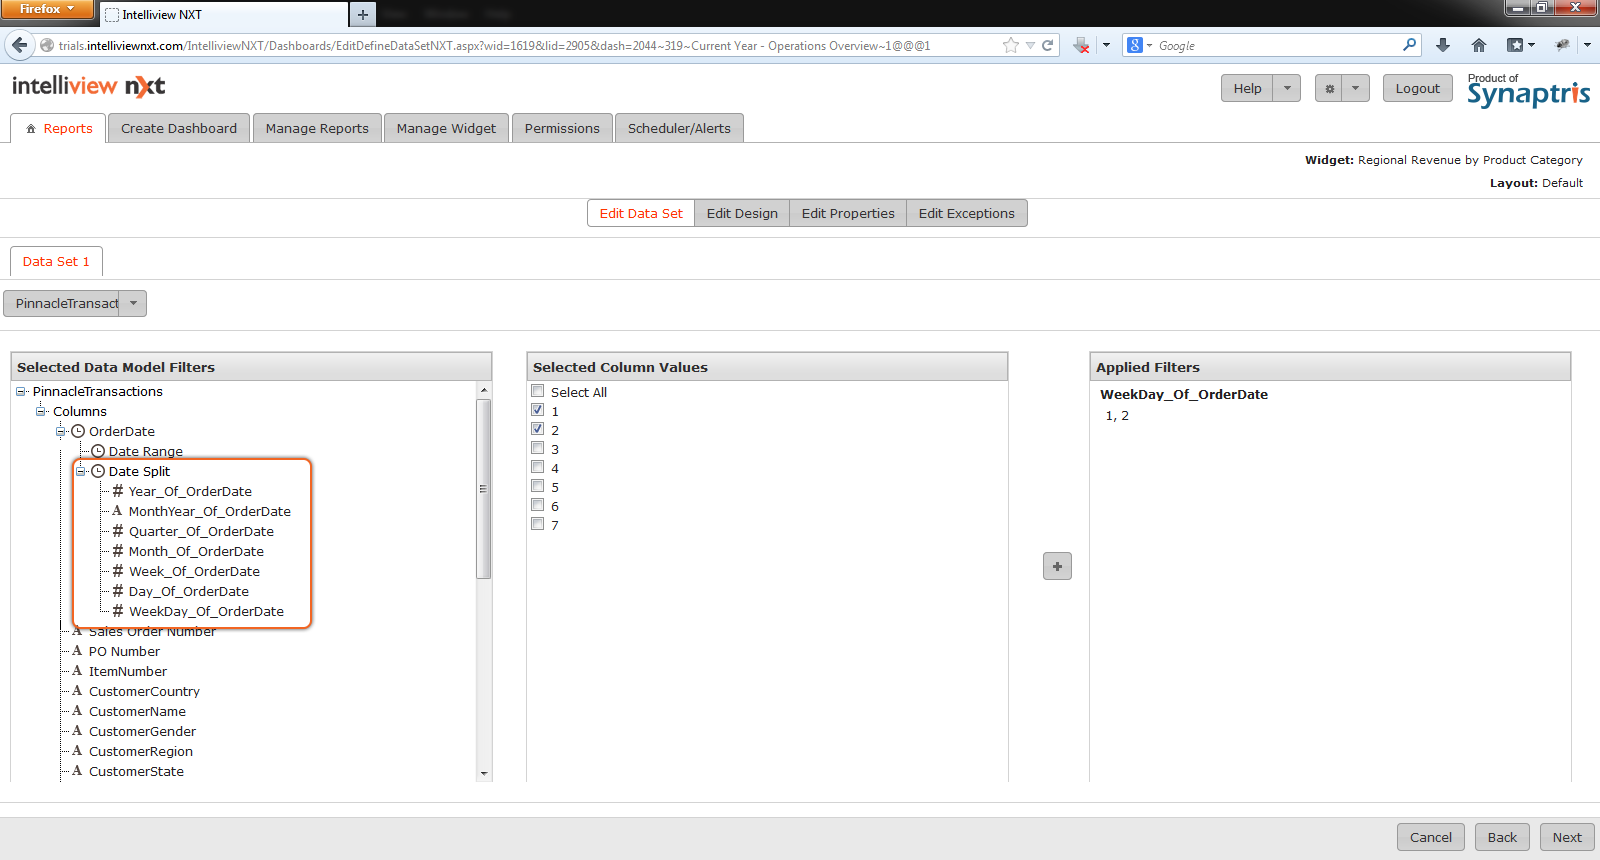
If you use the “Date Split” option, widgets can be created on the basis of just part of the date field like for instance “WeekDay_of_OrderDate”. This would enable you to create a widget that uses data only pertaining to on orders received on particular days of the week alone. The example illustration below shows a filter for “OrderDate” falling on Mondays and Tuesdays alone.
![]()
<< Edit Widgets | Edit Chart Design >>