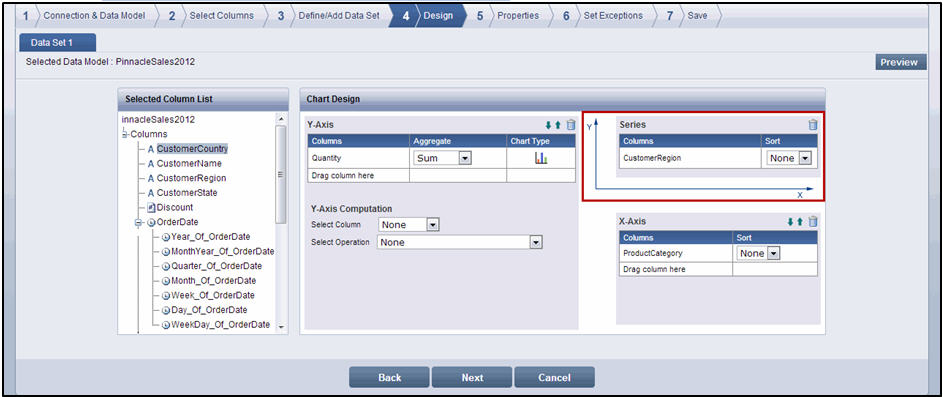
When you design a chart widget using a chart type like a Column chart that supports both single and multiple data sets, you have the option of adding a column to the Series section in addition to the X-Axis and Y-Axis sections
In the following sample screenshot, adding Customer Region to the Series section presents product volume by product category and within each product category presents an individual column for each unique customer region value
Screenshot - A

The sample screenshots in the following section illustrate the use of a column in the Series section. Screenshot A shows the chart design with Customer Region applied to the Series section. Screenshot B and Screenshot C show the chart without the Series column