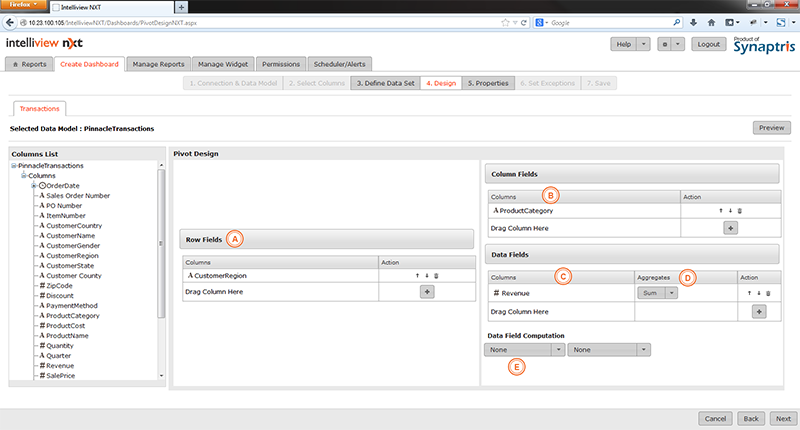
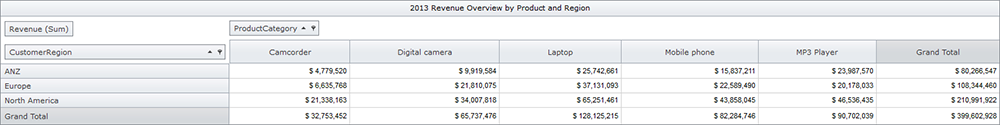
After defining data sets, you are at the Design stage. Below is a screen shot of the design page for the Pivot widget. This is the screenshot of the design screen used to generate the pivot widget illustrated below the design screen.
|
A |
The column(s) that you choose to use here form the Row(s) of the pivot table. There will be a row displayed for every distinct value from the column used here. You may add more than 1 Column for sub-categorization (Drill down) of row data |
|
B |
The column(s) that you choose to use here form the Column(s) of the pivot table. There will be a Column displayed for every distinct value from the column used here. You may add more than 1 Column for sub-categorization (Drill down) of Column data |
|
C |
The column(s) you choose here will be summarized and presented for every unique Row & Column combination. You may add more than 1 column here to represent a summary for more than 1 column |
|
D |
Choose from the summary function in the drop down list - the choices are Sum, Average, Max, Min, Count and Count Distinct |
|
E |
If you wish to apply any computation to your data column, make the selection from this drop down list here |
Once you have completed the pivot design with appropriate columns, you can preview your Pivot.
When you are ready to move to the next stage of defining the Pivot Properties, go to the next page either by pressing ‘Next’ or by selecting ‘Properties’ from the menu tab above.
![]()
<<Create Pivot Widget - Define Data Set | Create Pivot Widget - Properties>>