Defining a data set (a subset of data returned by the Data Model) is the process of filtering or removing certain values from the data columns that you have chosen to use in your report. This is an optional step and if you do not wish to filter your data, you may move to the Design step straightaway.
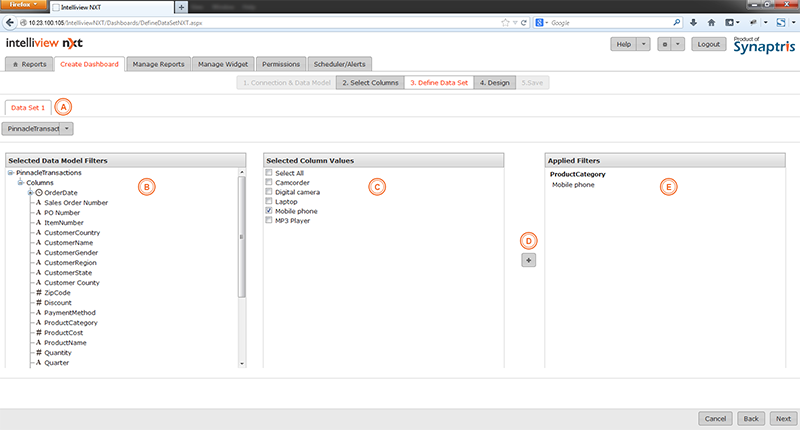
To define the data set (a subset of data returned by the Data Model), select the column you want to filter on the left pane. The corresponding column values will display under “Selected Column Values” in the middle pane. Uncheck values you do not wish to use in your report. When you click on +, the filtered list of column values will display under “Applied Filters” on the right pane.
You may give your own name to the Data Set you have designed by typing over the text on the tab heading (Data Set 1 is the default name which you can edit). You may filter values from as many columns as you wish under the same data set
If for example your data model contained sales data for multiple products for several years, but you wished to create a report for only one of the products, when you pick ‘Product Category’ from the column list on the left panel, the list of values in that column will display in the central panel. From this list you can choose which specific product you want to keep using the check box and apply your selection by clicking on the + sign. The screenshot below illustrates this example.
|
A |
Renamed Data Set |
|
B |
Click on a column name to see unique list of values in that column in the central panel |
|
C |
Select values you want to keep |
|
D |
Press here to apply filter |
|
E |
Filtered list of values |
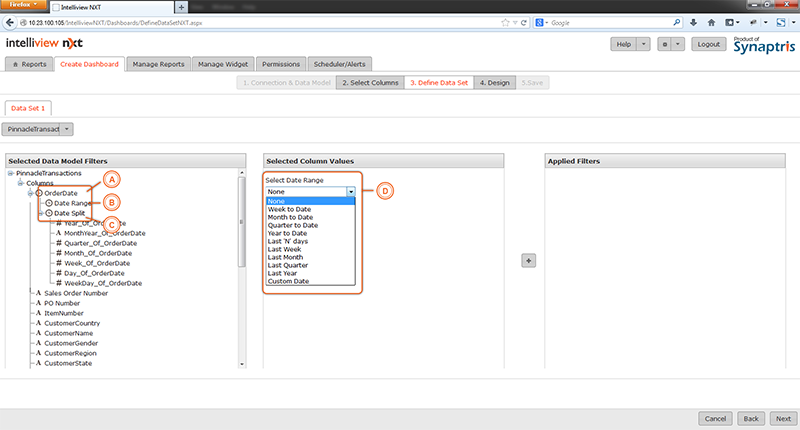
Intelliview NXT offers you multiple options on how you use date column filters in your widget.
Amongst other things, this feature can help keep your widgets/dashboards current. For example, using this feature you may set a filter on the date column to have the widget only populate with data for periods such as ‘Last month’. With such a filter, as the database continues to evolve over time with new data, the report would also get updated every month for the previous month. This date column filter feature allows numerous convenient customization and is explained in detailed below.
Two kinds of filters can be set up on date fields. One is the “Date Range” option while the other is the “Date Split”. If you use “Date Range” your reports will automatically be updated with additions to the database over time the illustration below shows expanded options available for date ranges.
|
A |
This data column ‘Orderdate’ in the database is a date field and filter options on this field are broadly divided into 2 categories |
|
B |
One of the filter options is “Date Range”. The types of date range are shown in next panel |
|
C |
The second filter option is “Date Split” –i.e the date field is split into various the components listed in next illustration |
|
D |
Options available under “Date Range” are listed here |
If you use the “Date Split” option, widgets can be created on the basis of just part of the date field like for instance “WeekDay_of_OrderDate”. This would enable you to create a widget that uses data only pertaining to on orders received on particular days of the week alone. The example illustration below shows a filter for “OrderDate” falling on Mondays and Tuesdays alone.
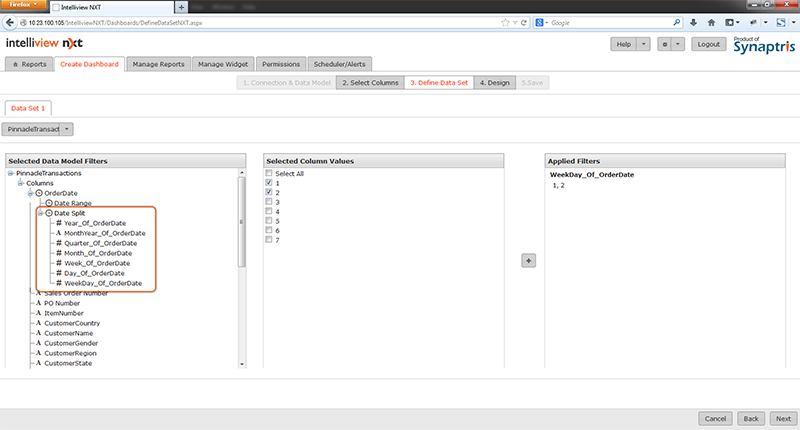
When your data set is ready, click next to go to the Chart Design page.
![]()
<<Create Table Widget - Select Columns page | Create Table Widget - Table Design>>