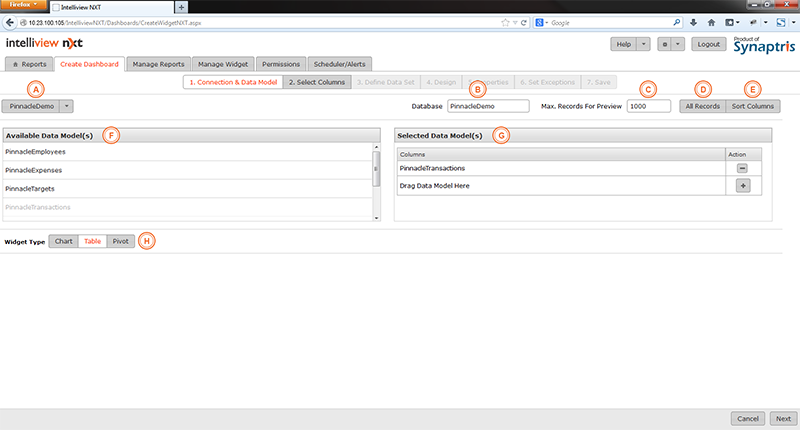
You begin by going to the Create Dashboard tab or Modify Report Tab and choose “Create Widget” which brings you to the first page of the widget creation workflow, i.e. the ‘Connection and Data Model’ page as shown in the image below.
|
A |
Select the database you wish to work with |
|
B |
Name of database you chose appears here |
|
C |
You may limit the number of records you wish to pull up for preview here |
|
D |
If you decide to work with all records, press this button |
|
E |
If you wish to view the columns in the data model that you picked in an alphabetic order, press ‘Sort Columns’ |
|
F |
List of data models associated with the database you chose appears here |
|
G |
Pick the data models you wish to work with from list on left and move them here. You may also press + to see the list of available data models and select one |
|
H |
Select the Widget Type here as Table |
The first step is to pick the database you wish to work with. Once you have done that, pick the data models which have the data fields relevant to your chart. Decide on how many records you want to pull up from the database and whether you wish the columns to be sorted into an alphabetic order for viewing on the next page. Pick ‘Table’ from Widget Type.
When you have picked the data model, you are ready to decide on which columns of data you wish to use by going to the ‘Select Columns’ tab. You can navigate to the next tab by using the “Next” button on the bottom right corner or by selecting it from the workflow sequence on the top.
<<Add Widget - Create Table Widget | Create Table Widget - Select Columns page>>