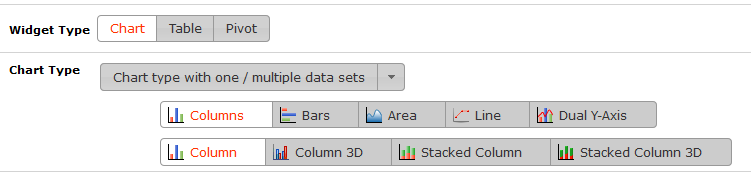
Column and Bar charts contain rectangular bars with lengths proportional to the values that they represent. Each bar or column corresponds to a category within the data. This means that data is divided into discrete groups like for instance year, country, salesperson, etc.
Vertical bar charts are called Column charts. When the bars are placed horizontally, they are usually known as Bar charts. Types of column and bar charts are shown in images below:
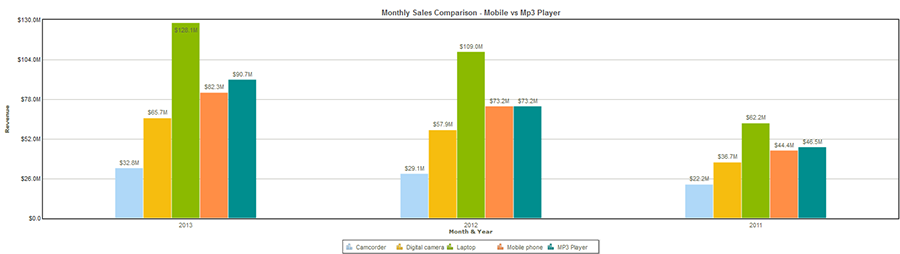
Fig. Multiple data set column charts
Below is an image of a multi-series column chart where the revenue data is categorized on the basis of ‘Year of order Date’. For each year, revenue achieved due to different products is super-imposed in this multi-series chart.
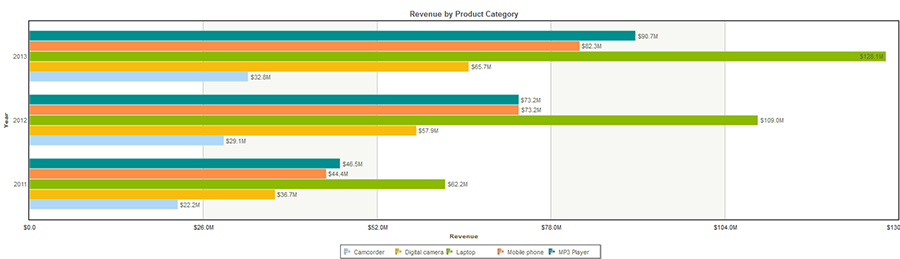
Below is an image of a multi-series bar chart where the revenue data is categorized on the basis of ‘Year of order Date’. For each year, revenue achieved due to different products is super-imposed in this multi-series chart.
Fig. Multiple data set bar charts
![]()
<<Chart Types - One/Multiple Data Set | Stacked Bar Charts>>