Click the Widget Options drop-down icon ![]() related to the widget in your dashboard view.
related to the widget in your dashboard view.
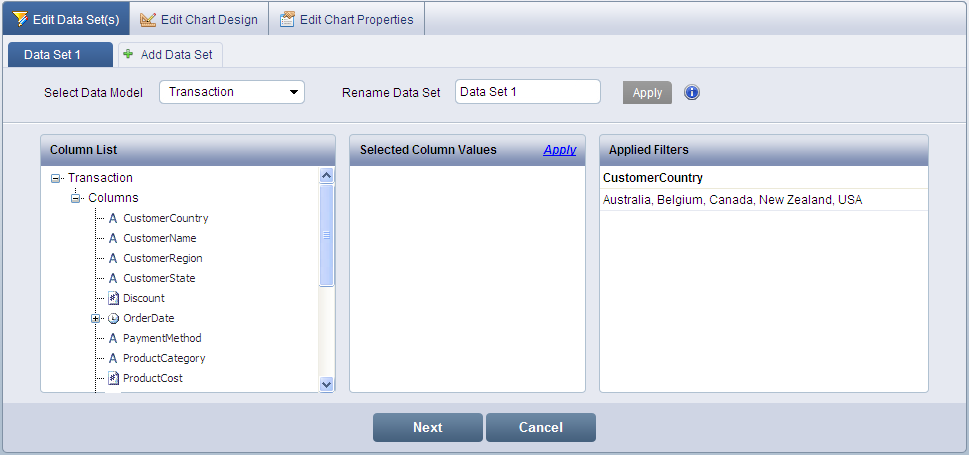
Select Edit Widget from the drop-down list. The Edit Data Set(s) screen displays. Change the data set filter values or add new data set to your chart widget, if required.
Click Next to display the Edit Chart Design screen. Edit the chart design by changing chart type, dragging and dropping the necessary columns in X-Axis, Y-Axis or Series.

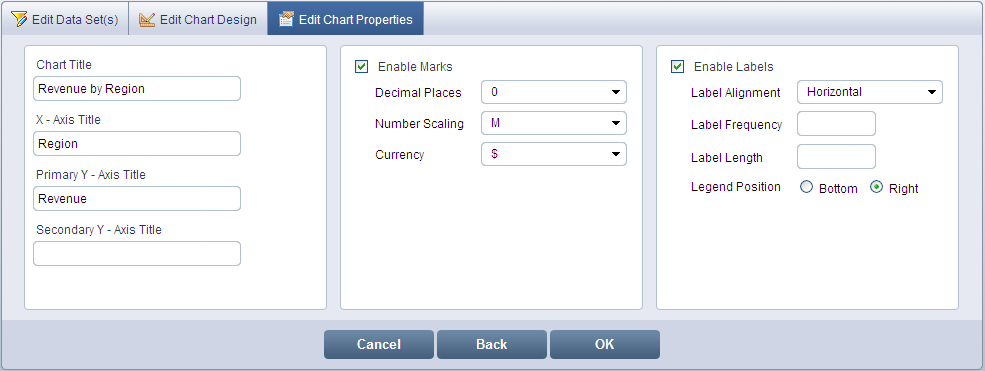
Click Next to Edit Chart Properties, else click OK to view the changes. To return to the previous screen, click Back.
Changes made to the widget can be saved as widget layout by clicking Save Layout As from the Widget Options drop-down icon.