Charts are visually appealing and make it easy for users to see comparisons, patterns, and trends in data. The Chart Widget is a versatile facility for creating two-dimensional and three Dimensional charts.
View a sample Chart Widget
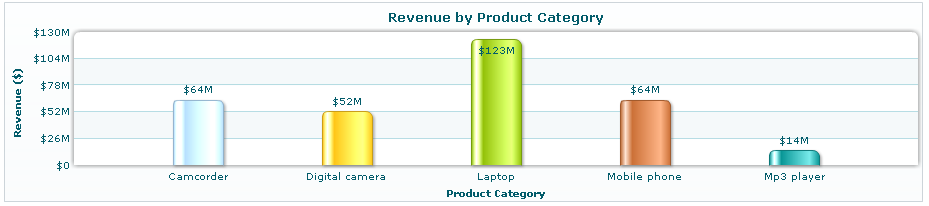
The Chart Widget displays data in a column, bar, area, line, dual Y-Axis, pie, doughnut, funnel, gauge or waterfall. You can configure the chart in the following ways: For example, You must initially connect to a database and a data model; select columns; define data set; drag and drop columns in chart axes; set parameters and save. You can specify X-Axis and Y-Axis titles; you can manipulate the data by enabling labels and values as well as exclude columns from the data.
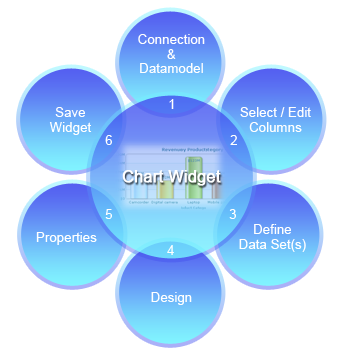
* Click on any widget process to view its detailed description