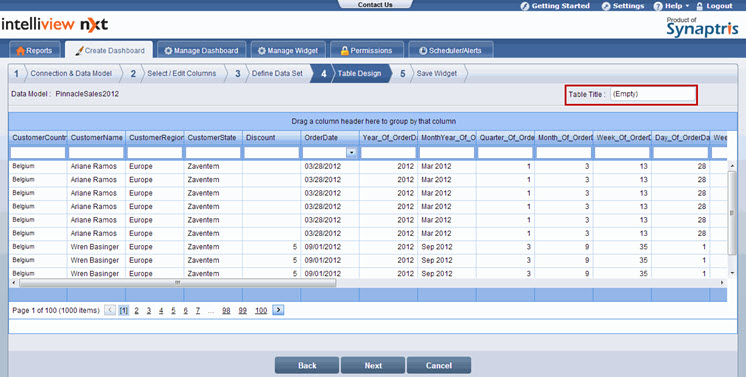
If needed, enter a title for the table widget in the Table Title text box.
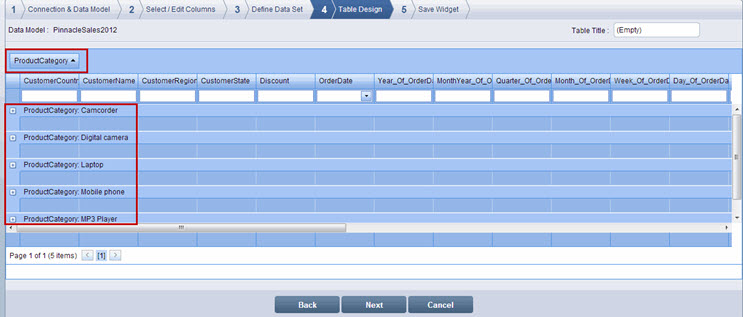
Drag the column header by which you want to group data in the table and drop it in the table header section. The table data is rearranged.
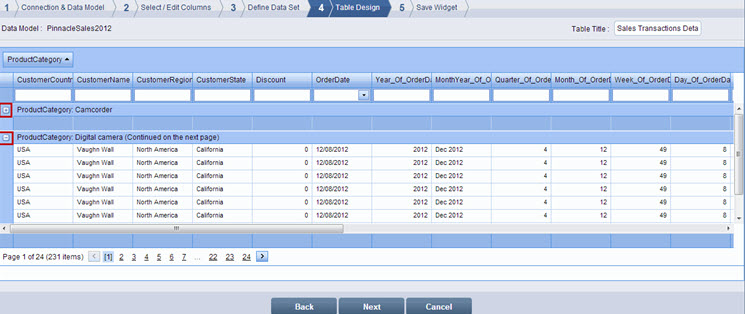
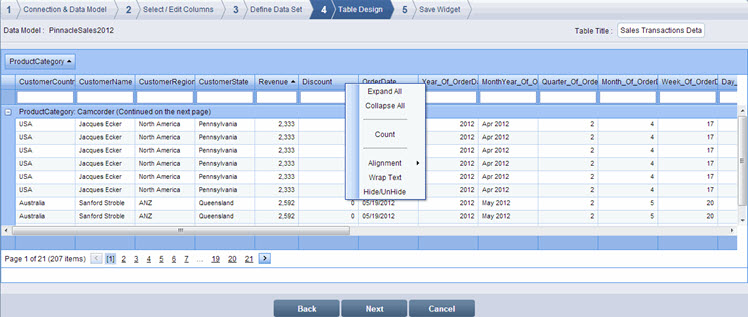
After grouping data, if you want to expand or collapse the groups, do one of the following:
Click the ![]() sign next to a group to expand the group. To collapse an expanded group, click the
sign next to a group to expand the group. To collapse an expanded group, click the ![]() sign next to the group
sign next to the group
- Or -
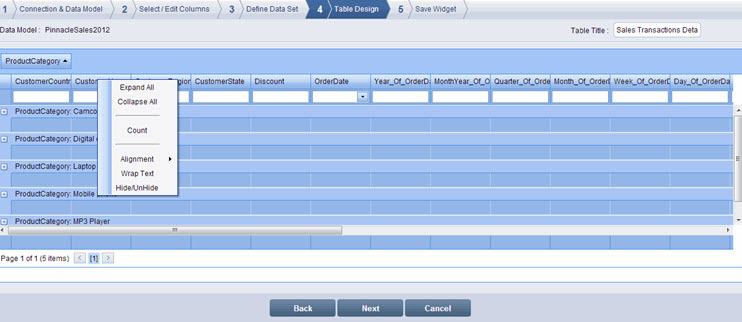
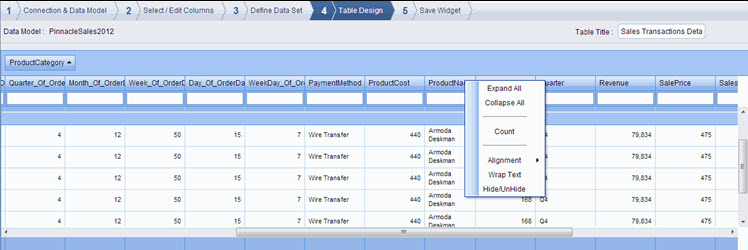
(a) Right-click on a column to view the shortcut menu.
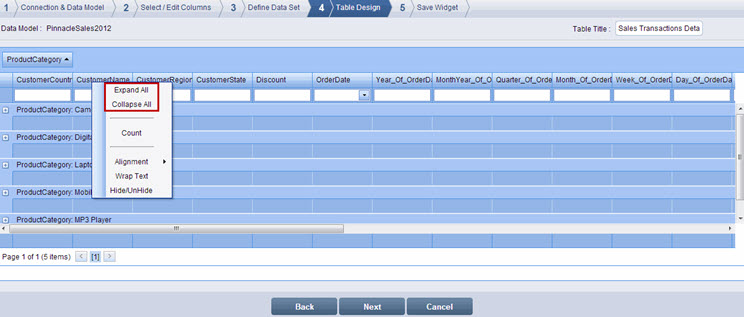
(b) To expand all the groups, click Expand All. To collapse all the expanded groups, click Collapse All. Depending on your selection, the groupsare either expanded or collapsed.
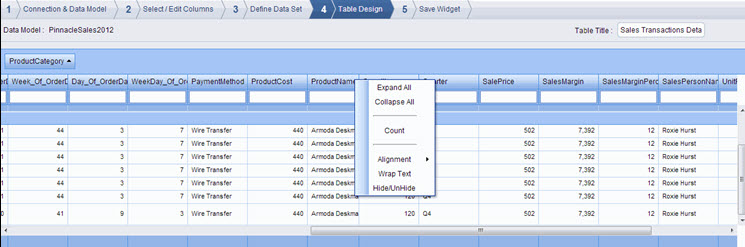
If you want to apply a summary operation on a column, right-click on the column. A shortcut menu appears. Depending on the column type, you can obtain the sum, minimum, maximum, count, and average of the values.
Click the required operation. In the following sample Screenshot A, notice that right clicking on the Customer Name column and then selecting Count, displays the count of customers for each product category. In the sample Screenshot B, notice that right clicking on the Revenue column and then selecting Sum, displays the sum of the revenue for each product category group.
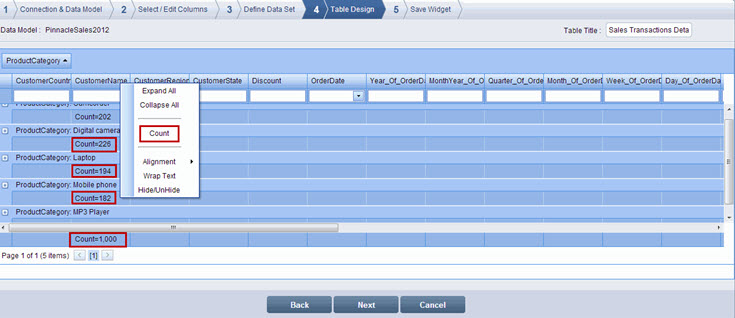
Screenshot A
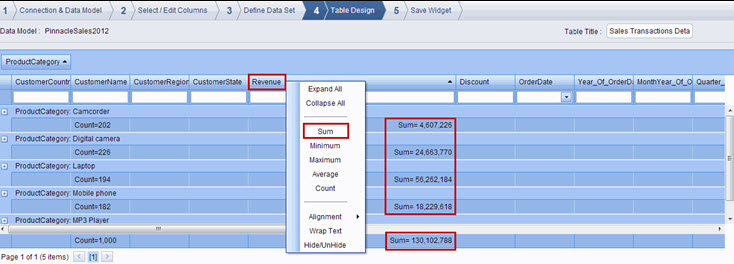
Screenshot B
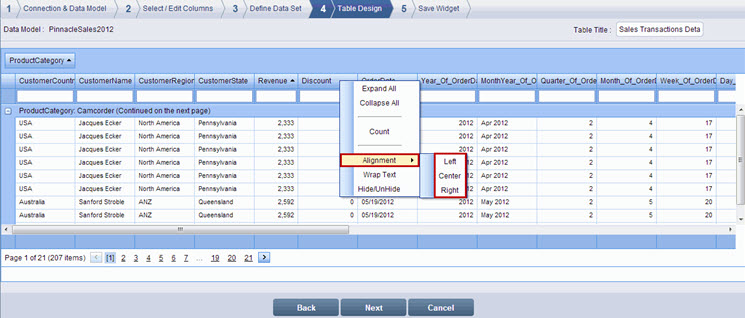
To align the values of a column to the left, center, or right, right-click on the column. A shortcut menu appears
Click Alignment >Left, Center, or Right. Depending on your selection, the values of the column are left, center, or right aligned
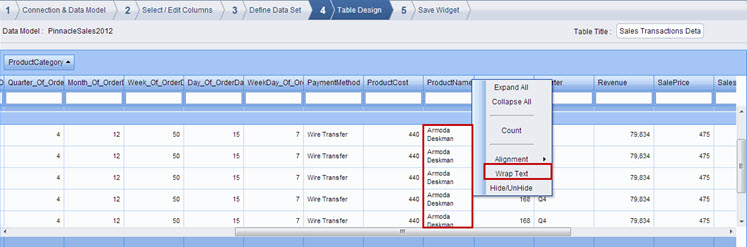
If you want to wrap the values of columns, right-click on a column. A shortcut menu appears.
Click Wrap Text. The values are wrapped within the cells.
To hide or show a column, right-click on the column. A shortcut menu appears.
Click Hide/Unhide. The Show/Hide Columns dialog box is displayed.
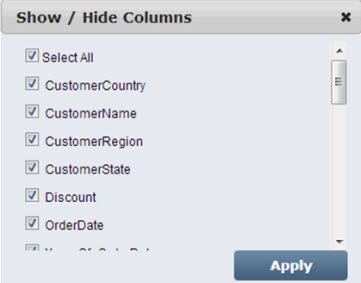
Clear the check box corresponding to the column that you want to hide or select the check box corresponding to the column that you want to display. For example, you can hide the date split columns Year_Of_OrderDate, MonthYear_Of_OrderDate, Quarter_Of_OrderDate, Month_Of_OrderDate, Week_Of_OrderDate, Day_Of_OrderDate, and WeekDay_Of_OrderDate as shown in the sample screenshot below.
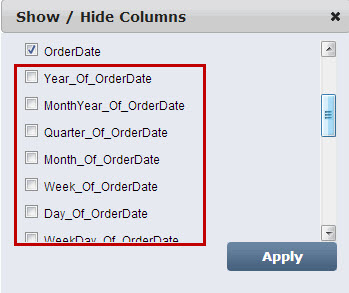
Click Apply. The Table Design page reloads and the changes you made are applied
After you finish designing the table, click Next on the Table Design page. The Save Widget page is displayed.
![]() Note:
Note:
Click Back to go to the Define Data Set page. Click Cancel to exit creation of widget.
![]()
<<Define Data Set(s) | Design>>