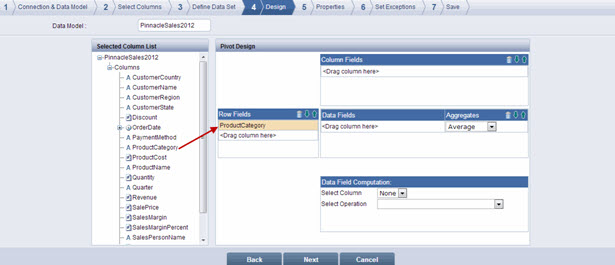
From the Selected Column List section, drag and drop the required column to the Row Fields subsection of the Pivot Design section.
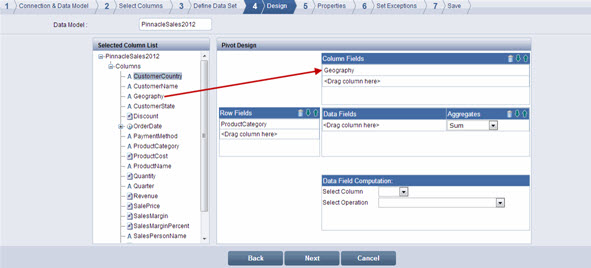
From the Selected Column List section, drag and drop the required column to the Column Fields subsection.
From the Selected Column List section, drag and drop the required column to the Data Fields subsection.
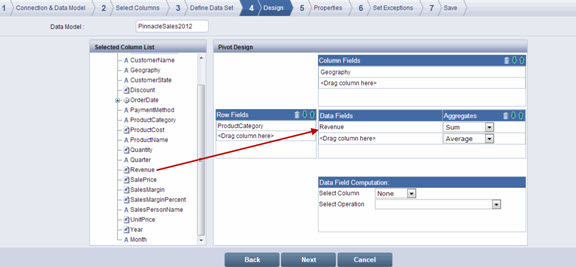
From the Aggregates drop-down list, select the required option.
![]() Note:
Note:
If you selected a text type column denoted by ![]() , the default aggregate function of Count is applied. The Count function returns the total count of value occurrences for the column.
, the default aggregate function of Count is applied. The Count function returns the total count of value occurrences for the column.
For a numeric column denoted by ![]() , the default aggregate function of Sum is applied. If needed, you can change the function by selecting one of the following options from the Aggregate drop-down list:
, the default aggregate function of Sum is applied. If needed, you can change the function by selecting one of the following options from the Aggregate drop-down list:
Sum – Returns the sum of value occurrences in a column
Average – Returns the mean of value occurrences for the column
Min – Returns the minimum value from the value occurrences for the column
Max – Returns the maximum value from the value occurrences for the column
Count – Returns the total count of value occurrences for the column
You can add any number of columns to the Row Fields, Column Fields, and Data Fields subsections. The down arrow ![]() in the subsections allows you to move a selected column down in the list. The up arrow
in the subsections allows you to move a selected column down in the list. The up arrow ![]() allows you to move a selected column up.
allows you to move a selected column up.
To delete a column, select the column and click ![]()
In the Data Field Computation section, select the data field column name from the Select Column drop-down list. The columns that you added in the Data Fields section are available in this drop-down list.
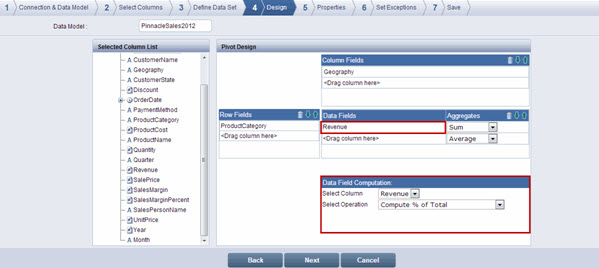
Select the required computation from the Select Operation drop-down list
![]() Note:
Note:
The options available in the Select Operation drop-down list are:
Compute % of Total –computes each unique displayed value of the selected data field as a percentage of the Grand Total value of that data field.
Compute % of Row Total –computes the value of the selected data field for a unique row field as a percentage of the total of all displayed values for that row field.
For example, if Revenue is the selected column for the data field computation, the row field is Product Category and the column field is Geography, applying Compute % of Row Total computes the Revenue for each Geography as a percentage of the total Product Category revenue for each unique row. If we consider the unique Product Category value as Laptop, the computation displays the percentage of the total Laptop revenue contributed by each of the Geographies.
Compute % of Column Total –computes the value of the selected data field for each unique column field as a percentage of the total of all displayed values for that unique column field.
For example, if Revenue is the selected column for the data field computation, the column field is Geography and the row field is Product Category, applying Compute % of Column Total computes the revenue for each Product Categoryas a percentage of the total Geography revenue for each unique column. If we consider the unique Geography value as Europe, the computation displays the percentage of the total Europe revenue contributed by each of the Product Categories.
Compute as a % of –selecting this option displays a section below it, where you can select a second column. It computes each unique displayed value of the selected data field as a percentage of the value returned by the computation selected for the second column.
For example, if Sales Margin Amount is the selected column for the data field computation, the selected second column is Revenue, and the selected aggregation is Sum, the result of the Compute as a % of operation is the computation of Sales Margin as a percentage of Revenue.
Compute the Difference from (-) – selecting this option displays a section below it, where you can select a second column. It computes each unique displayed value of the selected data field and subtracts the value returned by the computation selected for the second column.
For example, if Revenue is the selected column for the data field computation, the selected second column is Sales Margin, and the selected aggregation is Sum, the Compute the Difference from (-) operation subtracts the Sales Margin amount from the Revenue amount and returns the value, which in this case is the cost.
Compute the Sum of (+) –selecting this option displays a section below it, where you can select a second column. It computes each unique displayed value of the selected data field and adds the value returned by the computation selected for the second column.
Compute the Division by (÷) – selecting this option displays a section below it, where you can select a second column. It computes each unique displayed value of the selected data field and divides it by the value returned by the computation selected for the second column.
For example, if Revenue is the selected column for the data field computation, the selected second column is Customer Name, and the selected aggregation is Count, the Compute the Division by (÷) operation divides the Revenue amount by the Count of Customers and returns the value, which in this case is the Average Revenue.
Compute the Multiplication by (*) –selecting this option displays a section below it, where you can select a second column. It computes each unique displayed value of the selected data field and multiplies it by the value returned by the computation selected for the second column.
For example, if Revenue is the selected column for the data field computation, the selected second column is Sales Margin Percent, and the selected aggregation is Average, the Compute the Multiplication by (*) operation multiplies the Revenue amount by the Sales Margin Percent and returns the value, which in this case is the Sales Margin Amount.
Click Next. The Properties page is displayed.
![]() Note:
Note:
Click Back to go to the Define Data Set page. Click Cancel to exit creation of widget
![]()
<<Define Data Set(s) | Properties>>