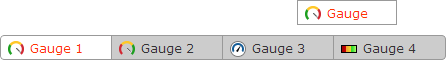
In a Gauge chart, the data values between specified minimum and maximum values are classified into different ranges. Once the gauge values have been specified, the performance of the business metric is illustrated with the help of the indicator
![]()
<<Funnel Charts | Waterfall Charts>>