The Define Data Set feature involves setting up and defining the data set to reflect how you need the data set represented in the widget.
For chart types with a single data set, there can be only one data set. For chart types with one/multiple data sets, you can add more than one data set. For information on how to add data sets, refer To_add_a_Data_Set:
To Define Data Set:
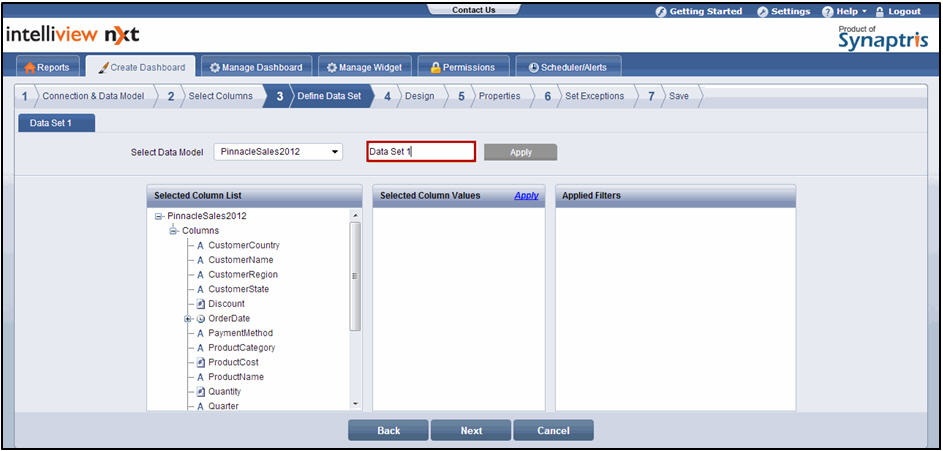
If needed, change the data model by selecting an appropriate data model from the Select Data Model drop-down list and then modify the data set name in the corresponding text box
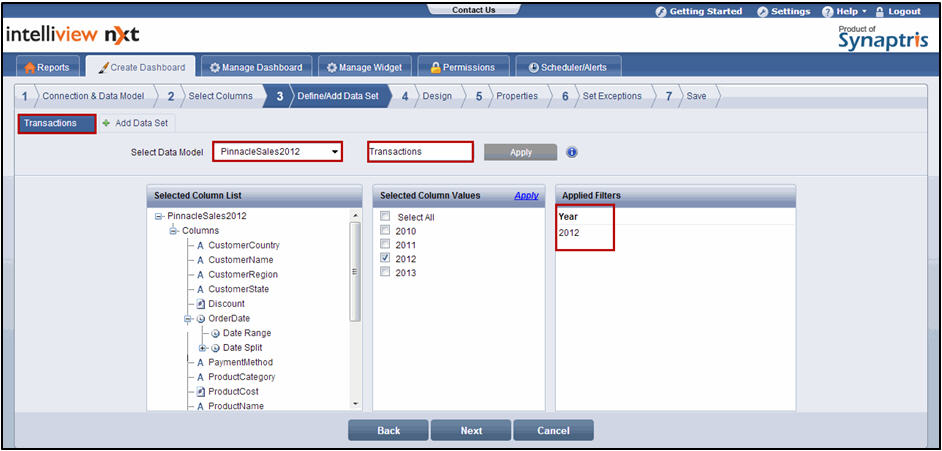
Define Data Set screen
Click Apply to save the changes.
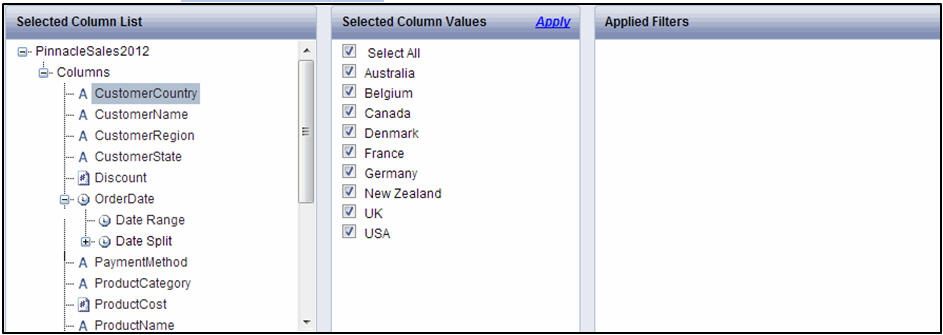
In the Selected Column List section, select the column name for which you want to view the column values. The column values are displayed in the Selected Column Values section. By default, the Select All check box is selected in the Selected Column Values section
![]() Note:
Note:
Date columns denoted by the ![]() sign are categorized into the following sub columns:
sign are categorized into the following sub columns:
Date Range: Select the date range option if you want the data in the widget automatically updated for the selected date range on an ongoing basis. The date range options are Week to Date, Month to Date, Quarter to Date, Year to Date, Last Week, Last Month, Last Quarter, Last Year, and Custom Date
For example, if you select the Last Month date range option, and view the widget in the month of April, the metrics for the month of March are automatically displayed. If you view the same widget in June, the metrics for the previous month, May are automatically display
The only exception to the automatic updates is that if you select Custom Date range, the specific Start Date and End Date you select are used on an ongoing basis and are not automatically updated
Date Split: Select the date split option if you want the data in the widget to reflect specific date split selections such as Year, Quarter, Month-Year, and so on, irrespective of the current date. The date split options are Year_Of_Date, MonthYear_Of_Date, Quarter_Of_Date, Month_Of_Date, Week_Of_Date, Day_Of_Date, and WeekDay_Of_Date
For example, if you select the Year_Of_Date option, a list of all unique year values available for that date column is displayed. If you select 2012 as the value and apply the filter, the widget will continue to present the metrics of 2012 irrespective of when you view the report
You can select either the Date Range sub column or the Date Split sub column
![]()
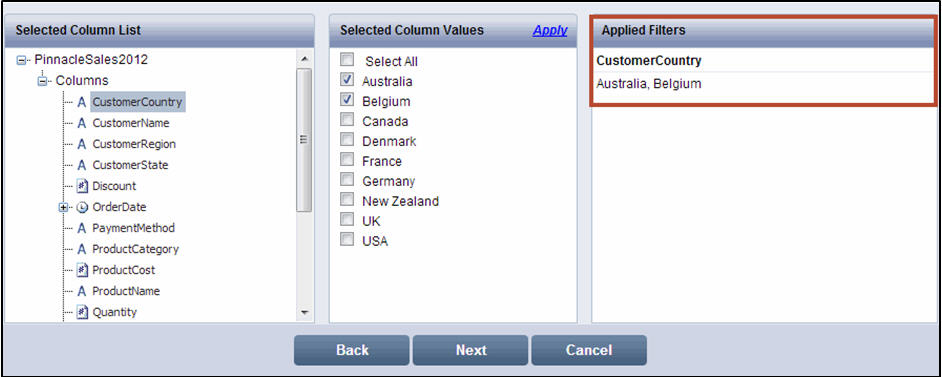
If needed, either clear the Select All check box and then select values or clear the check boxes corresponding to the values that you do not want to include
Click Apply. The selected values are displayed in the Applied Filters section. For example, if you want to design a widget to present Unit Shipments only for two Countries – Australia and Belgium, you can select the Country column and only select Australia and Belgium. In this case, you have defined the data set for the widget to reflect data only for these two countries. The data set you define can be changed by modifying the widget while viewing the dashboard
![]() Note:
Note:
You can either remove or modify the applied filters
To remove the applied filters:
Select the column name in the Selected Column List section
In the Selected Column Values section, select the Select All check box and click Apply. The existing values in the Applied Filters section for the selected column are removed
To modify applied filters:
Select the column name in the Selected Column List section
In the Selected Column Values section, clear the check box for the filter value you want to remove
Select the check box for the filter values you want to add and click Apply. The existing values in the Applied Filters section are modified based on your selection
Click Next. The Design page is displayed. For information on how to add details in the Design page, refer Design.
![]() Note:
Note:
Click Back to go to the Select Columns page. Click Cancel to exit creation of widget
On the Define/Add Data Set page, click the Add Data Set tab. The Data Set 2 page is displayed.
![]() Note:
Note:
The Add Data Set tab is available only for chart types with one/multiple data sets. You can add a maximum of five data sets. For more information on multiple data sets, refer Working with Multiple Data Sets.
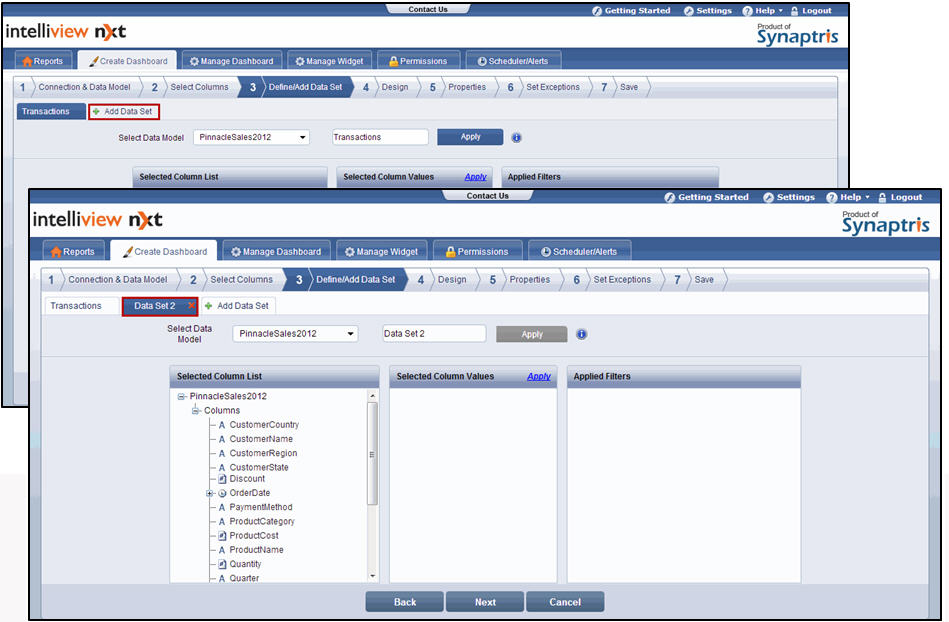
On the Data Set 2 page, define the second data set. For information on how to define a data set, refer To define a data set.
For example, you could select the PinnacleSales2012 Data Model that retrieves sales transaction data from the database, map it to Data Set 1(which you can rename as Transactions) and define the data set to represent only 2012 data by filtering it for the year 2012.
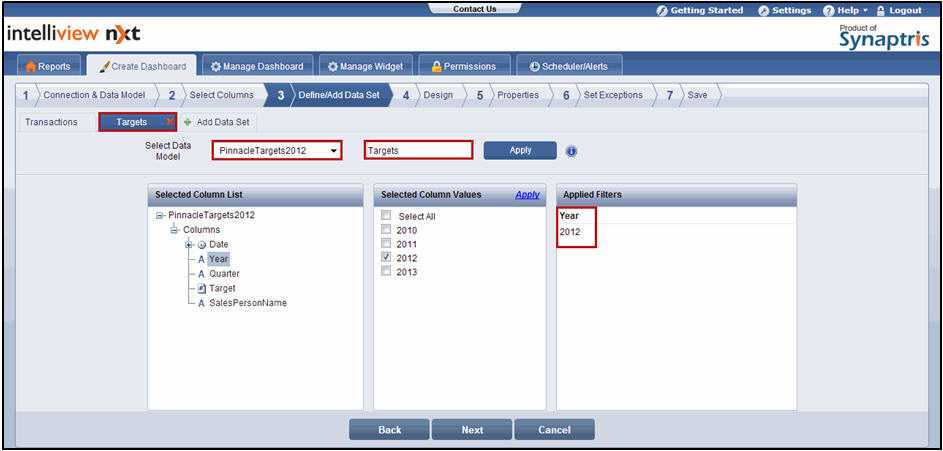
You could then click the Add Data Set tab, select the PinnacleTargets2012 Data Model that retrieves sales target data from the database, map it to Data Set 2 (which you can rename as Targets) and define the data set to represent only 2012 data by filtering it for the year 2012
After adding the required number of data sets (up to a maximum of six data sets) and defining each of the data sets, click Next. The Design page is displayed
![]()
<<Select Columns | Design>>