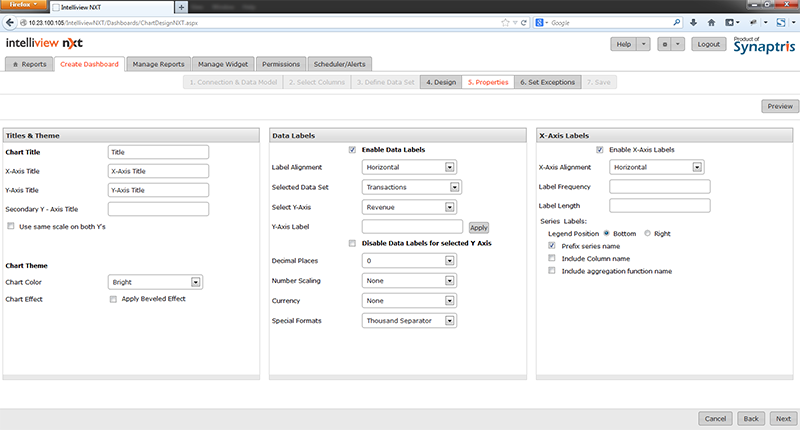
In this page Chart properties are specified. The table below the illustration explains the fields on this page in detail.
Field Description – Properties (Chart Type with One / Multiple Data Set)
|
Field |
Description |
|
Chart Title |
Enter a title for the chart/widget |
|
X-Axis Title |
Label for X-Axis |
|
Y-Axis Title |
Label for Y-Axis |
|
Chart Color |
Choose a color theme (bright, pastel, blue, green etc) for your chart from drop-down list |
|
Chart Effect |
Check this box if you wish your graphs to be bevelled in appearance |
|
Enable Data Labels for Y Axis Column |
|
|
Enable Data Labels |
Select this check box to display data labels on the chart |
|
Label Alignments |
You can choose to display data labels either horizontally or vertically |
|
Selected Data Set |
If you are using more than 1 dataset, pick the name of data set for which you want to define labels |
|
Select Y Axis |
If you are using more than 1 dataset or if you are using multiple Y axis in a dataset, pick the Y axis column for which you want to define labels |
|
Y-Axis Label |
The default value for the Y Axis Label is the name of the Y-axis column. If you have performed computations on the Y-axis column or if you are using the Y-axis column to represent a metric that is not evident from the name of the Y-axis column, you can enter a label for the Y-axis and have it replace the Y-axis column name |
|
Disable Data labels for selected Y Axis |
You can use this check box if you want to disable marks for the selected Y-axis column. When the Disable Marks for selected Y Axis check box is selected, the Decimal Places, Number Scaling, Currency, and Special Formats fields become non-editable |
|
Decimal Places |
Select the number of decimal places from the drop-down list |
|
Number Scaling |
Select the value for number scaling. The options are:
|
|
Currency |
Select the currency from the drop-down list. The options are $, ¥, £, €, and Rs. |
|
Special Formats |
If needed, select the special format from the drop-down list. The options are:
|
|
Define X Axis Label Properties |
|
|
Enable X Axis Labels |
Select the check box to enable labels for the X Axis. The X-axis labels are enabled by default and the unique X-axis values are displayed as the X Axis labels |
|
X-Axis Alignment |
You can choose to have the X-Axis label aligned either vertically or horizontally |
|
Label Frequency |
If there are too many X Axis label values, you can specify the frequency to display the X Axis label |
|
Label Length |
If the X Axis label length is too long, you can restrict the length of the X-axis label |
|
Define Series Label Properties (The following fields will be available only when you use a column in the series area of the Chart Design |
|
|
Legend Position |
Displays each unique value of the Column used in Series as a unique color in the bottom or to the right of the chart |
|
Suffixseries value |
Displays the name of the Column used in the Y axis in addition to the color block and series value |
|
Include Column name |
Displays the name of the Column used in the Y axis in addition to the color block and series value |
|
Include aggregation function name |
Displays the aggregation function applied to the column used in the Y axis in addition to the color block and series value |
<<Create Chart Widget with One/Multiple data sets - Design Screen | Create Chart Widget with One/Multiple data sets - Set Exceptions Page>>