A list of all dashboards available for viewing is listed in a folder structure under the 'Reports' tab of Intelliview NXT. Selecting a dashboard loads the dashboard in the right pane.
You have many ways to customize the view of your dashboard to suit your specific needs as explained in the sections that follow.
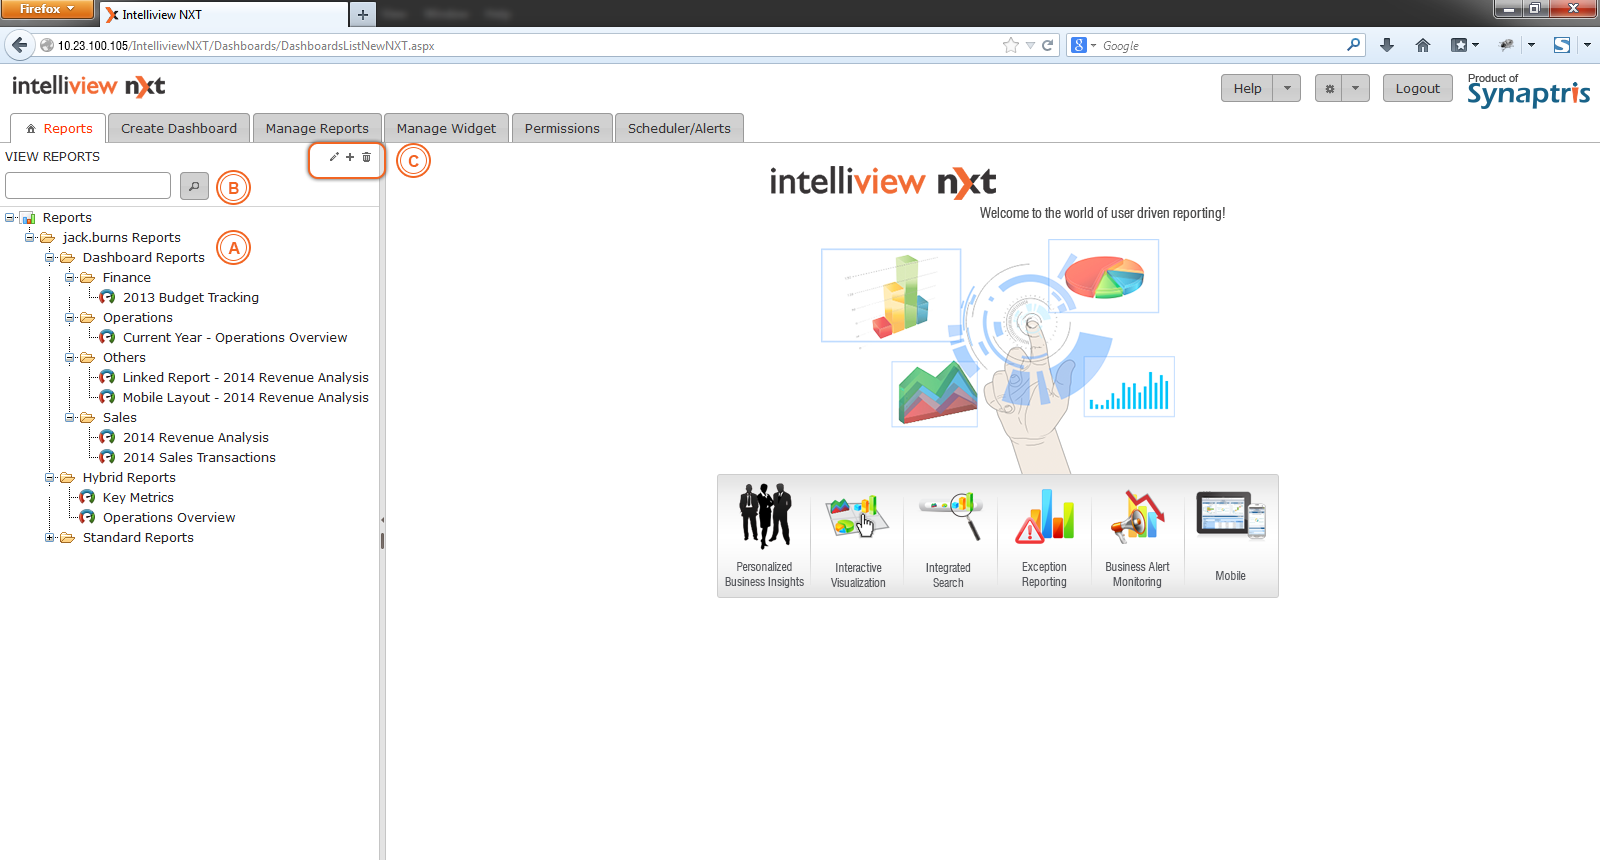
The image below illustrates the 'Reports' tab with list of folders and dashboards available in the account.
|
A |
List of all dashboards displayed here. |
|
B |
Search for a dashboard based on dashboard name. |
|
C |
Using these icons you may rename a folder, add a new folder or delete a folder. |
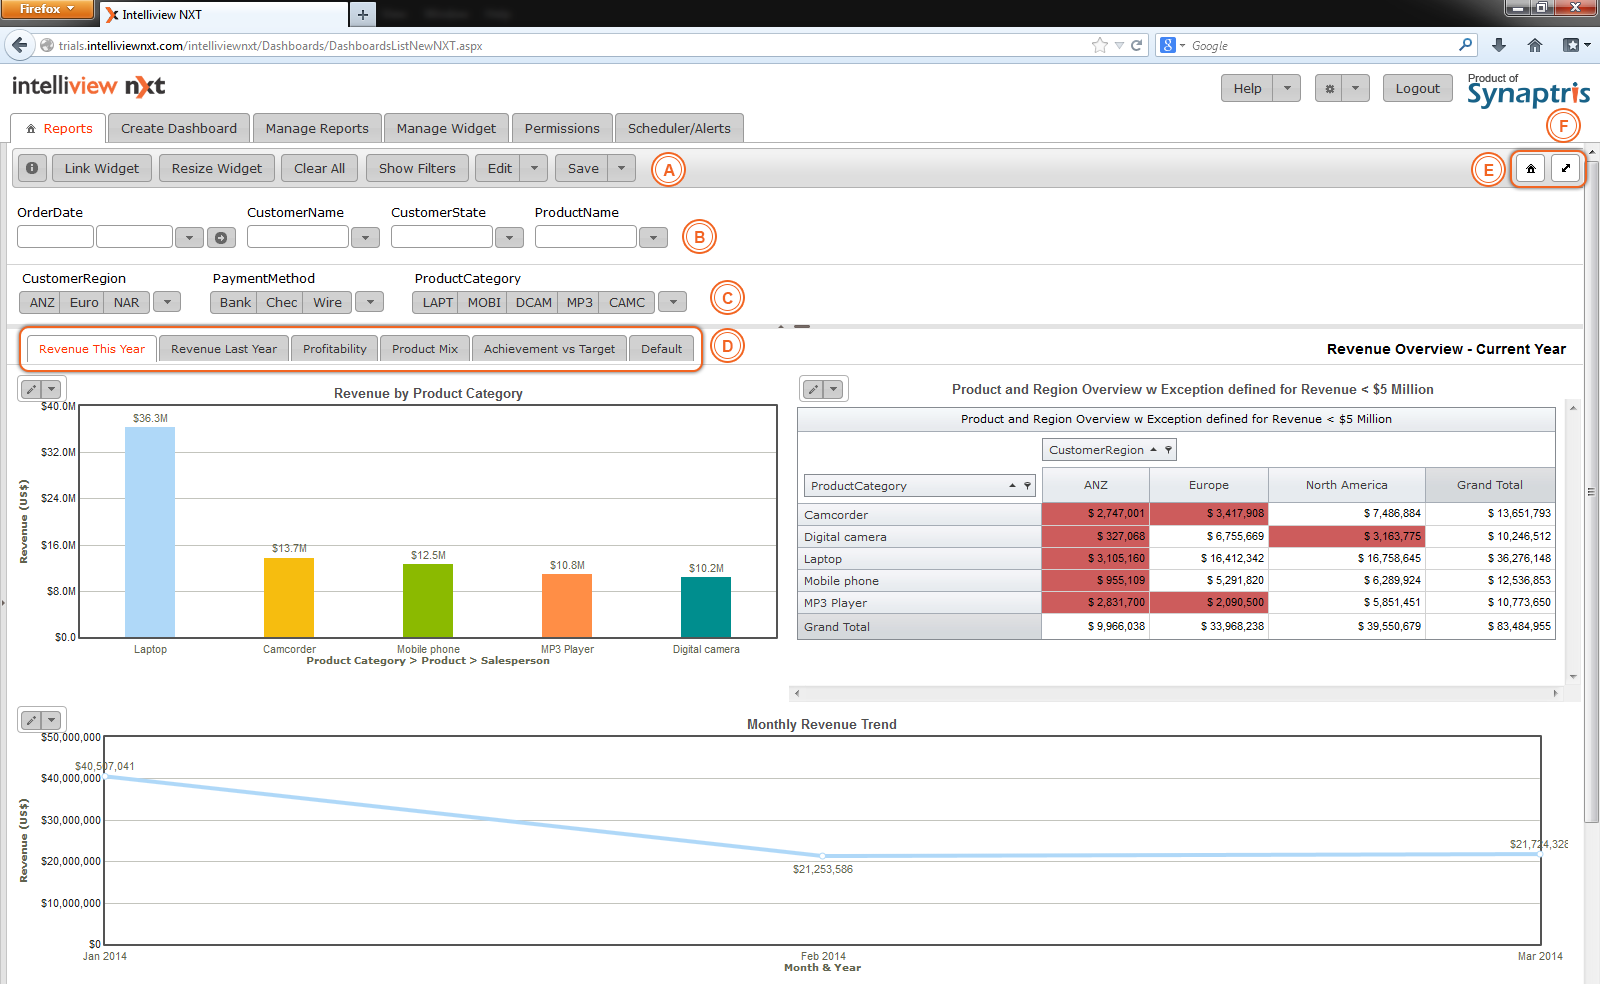
We will use a sample dashboard “Current Year - Operations Overview” (illustrated in the next image) to illustrate the dashboard viewing and interactive options available while viewing a dashboard.
The sample dashboard has two different types of widgets a chart and a pivot widget. There are four main sections to the dashboard. They are:
|
A |
The Dashboard Viewing Menu. |
|
B |
Quick Search |
|
C |
Smart Filters |
|
D |
Sub Reports |
|
E |
Home Button will exit the dashboard and return to the Reports (home page) tab |
|
F |
Clicking this button makes the dashboard full screen. |
This menu allows you to make dashboard level settings and alterations. Using this menu, you can link widgets, enable widget re-sizing so you can adapt the size of the widget to suit your particular screen resolution, clear all filters to reset the dashboard to its original state, view what filters are applied to the dashboard and export the dashboard to a PDF file.
'Quick Search Filters' or Quick Filters allow filtered views of the dashboard based on a search term or a selection of filter values from a drop down list. Using a Quick Search you can obtain a filtered view of the dashboard.
'Smart Filters' also allow filtered views of the dashboard but they can be obtained very quickly with just the click of a button. The buttons are surfaced in the Dashboard and display four character labels assigned to each unique value.
Editors and Authors can create 'Sub-Reports' of a dashboard. Sub-reports are basically altered versions of the original dashboard and each sub report is shown as a separate tab in the dashboard. Sub Reports created by the Dashboard Author is available for viewing by all users whereas sub reports created by the dashboard editor(s) are available only for their individual use.
Editors and Authors have extensive capabilities to modify and create sub-reports. One way is to apply dashboard level filters altering the data available to all of the widgets. Such filtered dashboards can be saved as sub-reports.
Further, Editors and Authors also have the capability to change the data-set, design, properties or exceptions of individual widgets in a dashboard. These changed widgets are saved as 'widget layouts'. The Editor/Author can mix and match the widget layout applied to the widget and create unique sub report for different widget layout combinations.
Sub-reports available for viewing are visible as tabs as shown in the image below:

We will look at the functionalities offered by each of the four sections in more detail within the topic, 'The Dashboard Viewing Menu'.
![]()